Lab 14: Abstract and Poster

Sydney Ortenberg
April 26, 2019
Lab 14: Abstract and Poster
Purpose:
The purpose of this lab was to improve our abstracts and posters for the Cili-CURE symposium. We also needed to vote on a logo and enter our information into the dropbox and class spreadsheets.
Procedures:
- vote on logo
- write down identifier on test tube
- record metadata on shared excel sheet
- work on abstract and poster
- upload abstract and poster to Dropbox
Data:
Soil ID: LOS22_3Sp19
GPS Location: -97, 30
Tree Species: Quercus Virginiana
BHD: 140cm
pH: 6.0
Soil Texture: sandy loam
Extraction: Silica Bead
DNA Concentration: 96ng/uL
Volume: 500
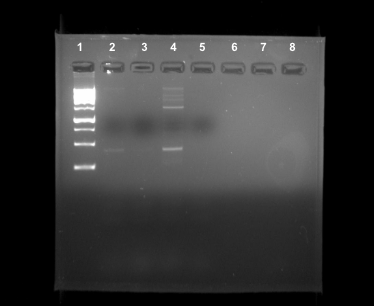
PCR: positive
Soil Label: SLO s2019
Abstract:
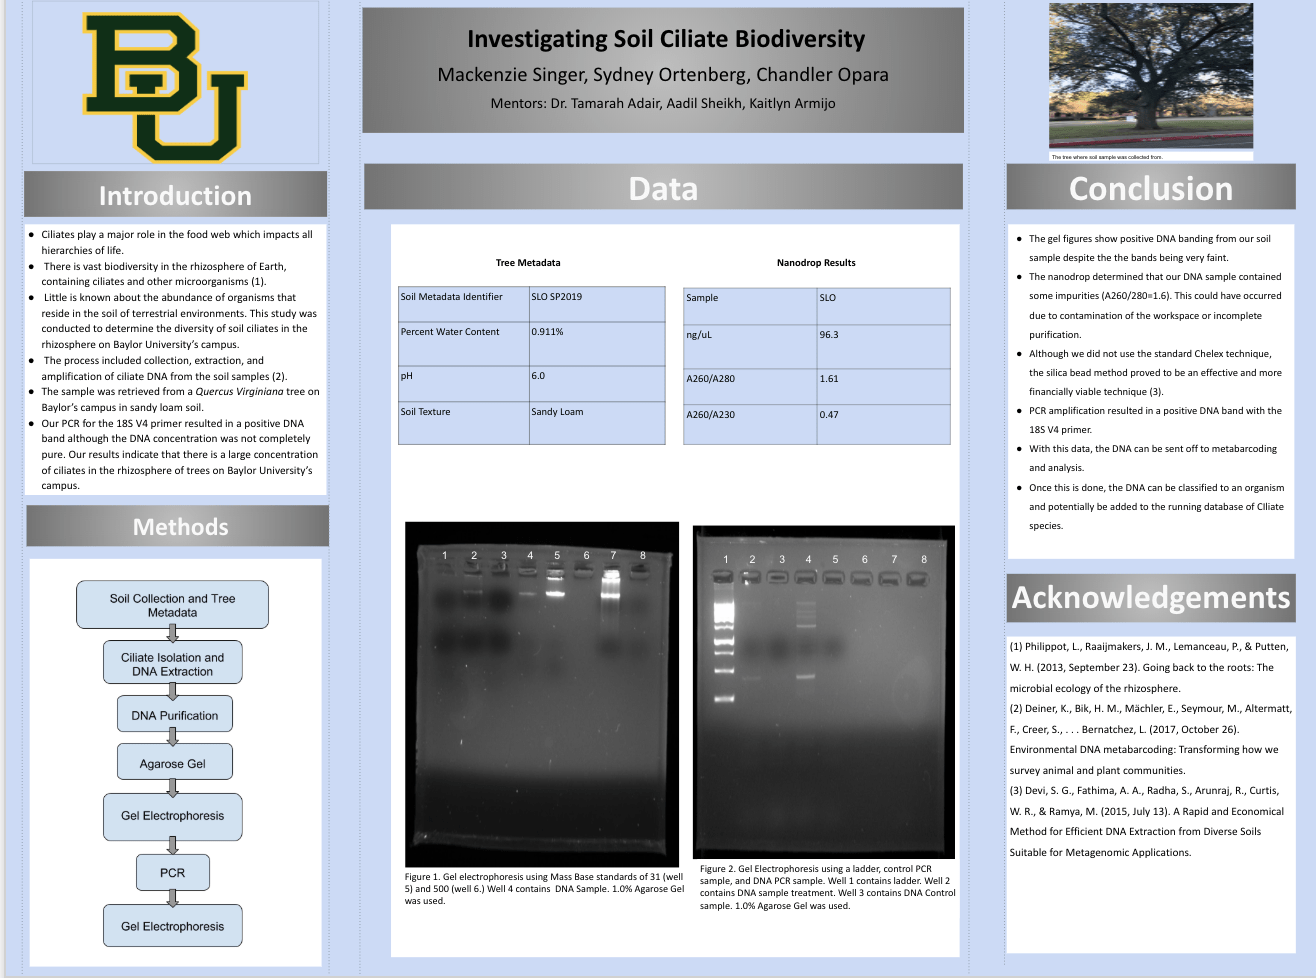
Ciliates play a major role in the food web which impacts all hierarchies of life. There is vast biodiversity in the rhizosphere of Earth, containing ciliates and other microorganisms (1). Little is known about the abundance of organisms that reside in the soil of terrestrial environments. This study was conducted to determine the diversity of soil ciliates in the rhizosphere on Baylor University’s campus. The process included collection, extraction, and amplification of ciliate DNA from the soil samples (2). The sample was retrieved from a Quercus Virginiana tree on Baylor’s campus in sandy loam soil. Our PCR for the 18S V4 primer resulted in a positive DNA band although the DNA concentration was not completely pure. Our results indicate that there is a large concentration of ciliates in the rhizosphere of trees on Baylor University’s campus.
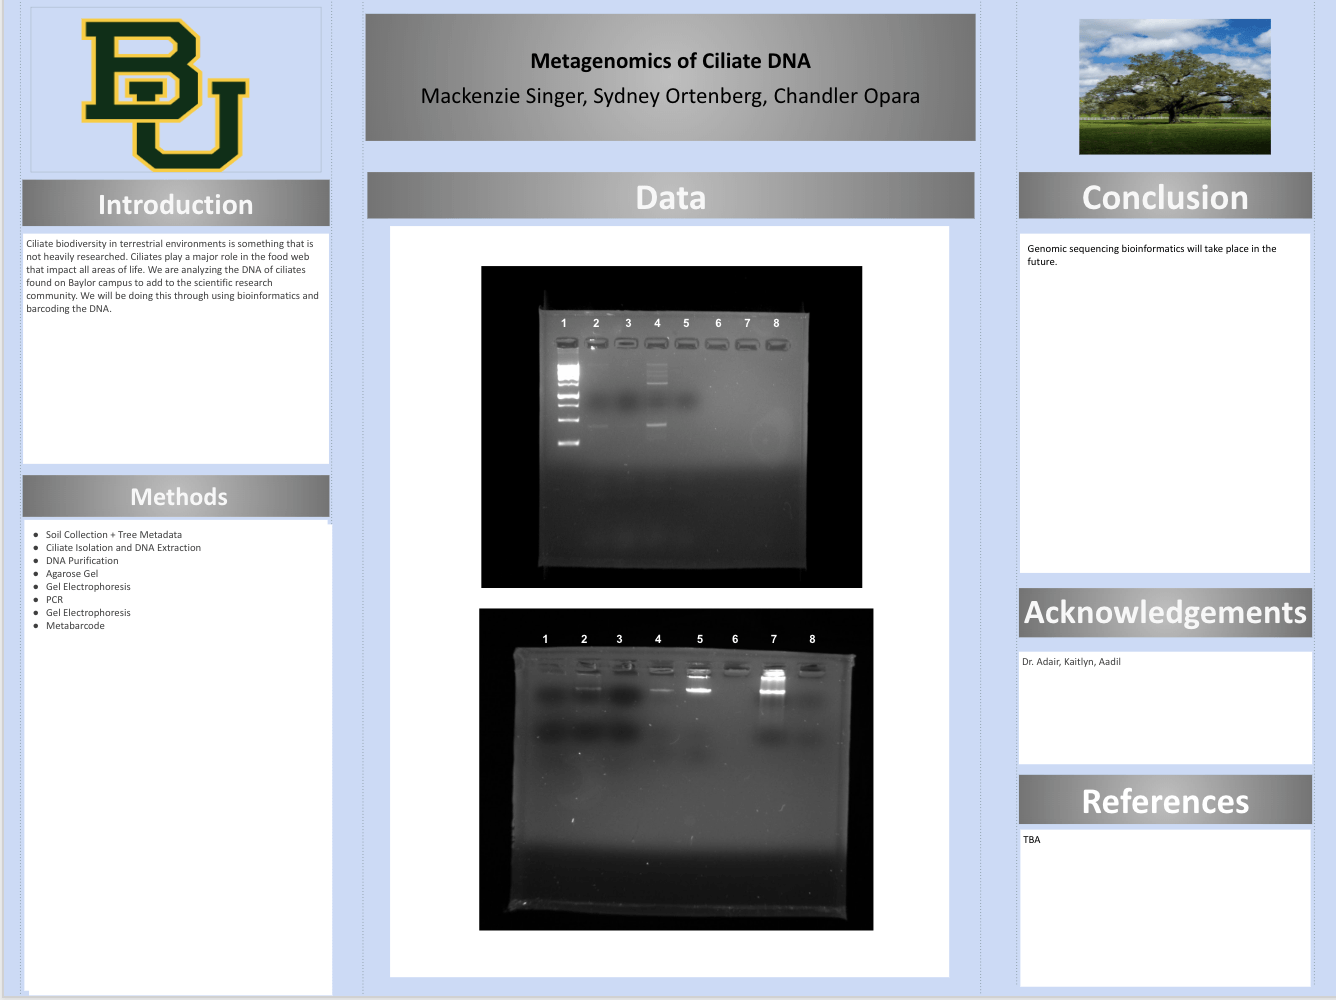
Title: Investigating Soil Ciliate Biodiversity
Storage: Data tubes were placed back on the rack.
Conclusion and Future Steps:
This lab allowed us to wrap up some things before we have our presentations and the symposium. We needed to record all of our data on the class spreadsheet so it is all organized and all of the data is in one place. We also took feedback from our TA and LA’s to improve our abstract and poster so they can be printed. As a group, we all edited our abstract and poster to make it better. We also voted on a logo for a sticker or T-shirt so we can always represent Cili-CURE throughout Baylor. In the future, the posters will be printed and we will have the CURE symposium in which we will show our posters and also have a presentation in class.