November 16

11/15 Lab 13: Ciliate Isolation and Characterization

Print Friendly, PDF & Email

Purpose

The purpose of this lab was to wrap up all the ends of the soil experiment and begin to prepare for the presentation. We continued to look for ciliates in our soil samples and took any photos that could be used in the presentation. Also we looked through our cultured plates to see if any ciliates had been obtained from last week. Before starting to observe under the microscope, we learned more about ciliate naming to understand better what we might find in the soil sample. This lab allowed us to pull all of our skills and ideas together and start on a presentation that exemplifies all of our work.

Procedure

  1. Obtain the soil sample from last week. It should have settled and you should be able to see three distinct layers in the order of sand, silt, clay.
  2. Have your lab partner hold up the tube with a ruler next to it for you to take a picture. This will allow for easier and more precise measurements.
  3. Now look at the tube and measure the total cm of the soil (ignore the water displaced on top). Then calculate the individual layers in cm. Now to find the percent composition of each layer, divide the individual cm by the total cm and multiply it by 100.
  4. Using the soil composition triangle, find where your composition puts you and record what the sample soil is.
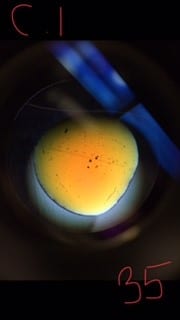
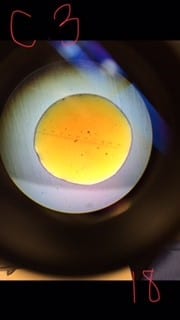
  5. Now move on to the culture well you made last week. Pipette 5 drops of 5μl onto a concavity slide. Look at each drop and take pictures if any ciliates are found.

Data

Table 1~ Soil Composition

Sample cm % Comp
Total Soil 2.5 n/a
Sand 0.9 36%
Silt 0.4 16%
Clay 1.2 48%
Soil Type Sandy Clay

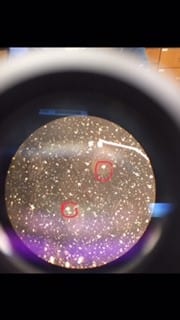
Picture of Culture Ciliates~

Storage

  • The soil tube was placed back on the rack.
  • The microscopes were unplugged and recovered.
  • The slide was rinsed and set on a paper towel to dry.
  • The culture well was covered and placed at the of the table.
  • The soil plate was placed back under the fume hood.

Conclusion

This lab was a great tie up to the semester’s experiments. Since we know the lab protocol well now, we were able to work fast and efficiently. In addition, finding more ciliates allowed us to continue to practice our microscope skills and prepare for our presentation by adding more photos to what we have already collected. I am excited to present our finding and display what we have learned so far in an engaging and professional manner.

November 9

11/8 Lab 12: Ciliate Classification

Print Friendly, PDF & Email

Purpose

The purpose of this lab was to combine all of our knowledge and to take control of our own learning. We have studied Tetrahymena, but for this lab, we expanded our horizons to the seven super groups and the whole phylum of Ciliophora. We quizzed ourselves (literally, I was third in Kahoot, whoo hoo:) and stretched ourselves to understand more of the ancestry of ciliates. It is important to examine this because this lab we continued to look at our wild ciliates in the soil, and we needed to know what we could possibly find.

Procedure

  1. Obtain a Falcon tube and your bag of collected dirt. My lab group all used Madison Ambrose’s dirt.
  2. Fill the tube to the 4 mark with dirt. Then add water until the mixture is at the 10 mark.
  3. Firmly place the cap on and place it on the vortex to adequately distribute the mixture. Write your Soil Identifier label (REW34F18) on the tube and store it in the test tube rack designated for your section.
  4.  Now obtain your plate.
  5. Pipette three drops of 10μl each onto a flat slide. This procedure will allow you to easily trap a ciliate. If your water amount is limited, you might find it easier to grab water with less soil particles in it if you rotate the plate so all the water flows to one section. You can now easily grab from the top of the water and minimize soil intake.
  6. Begin looking through the 10x magnification of the compound microscope. When you spot a ciliate, place a cover slip on top of the drop where it was found, and go up to the 40x magnification to get a closer look at your ciliate.
  7. Take pictures and record the types of ciliates you find as well as their number, size, shape, and other descriptions. Table 1 and 2.
  8. If you wish to culture your ciliates, grab a plate that is pre-prepared with media. Pipette 20μl of the water from your plate into the well. Write your name on it and store it at the end of the table where your instructor will collect it from you.

Data

Table 1~

Ciliate 1
Shape Long and skinny
Size Relatively large (~15 cells across diameter on 10x)
Swim pattern Random
Number 1

Table 2~

Ciliate 2
Shape Circular
Size Small (~40 cells across diameter on 10x)
Swim pattern Spherical Rotations
Number 2

Storage

  • The microscopes were unplugged and covered.
  • The tube of soil was placed in the tube rack for section 34 labeled REW34F18.
  • The plate with soil was placed under the fume hood.
  • The cultured ciliate plate was placed at the end of the table with the same label as the tube of soil.

Conclusion

This lab was exciting because we were able to compile all of our skills. Finding our own ciliates and discovering how they are related to one another was really interesting. Also we were given a tree and asked how different families were all related and we could see how we as humans are closely related to many other living organisms. There is not a whole lot of research being done on ciliates which opens the door for us to discover some new and exciting things. As we compare our Tetrahymena experiment to our more wild ciliate experiment now, we can see how all these organisms are effected by one another and the role we play in preserving them. I am excited to see if my ciliates that I cultured will be preserved because then we can go in and decipher the DNA sequence of the ciliates which would add another reason why these cells are so interesting and intricate and deserve more research.

November 2

11/1 Lab 11: Soil Ciliate Discovery; Soil Metadata 1

Print Friendly, PDF & Email

Purpose

The purpose of this lab was to begin a new experiment that would give a more in depth reason as to why ciliates are important in the soil system as well as to the world as a whole. We have already looked at how microplastics influence a specific ciliate, Tetrahymena, but now we can see really how they are present in the soil by finding them in our wild soil samples, and their place in the soil food chain. These general points were our purpose for today’s lab as we embark on a new experiment.

Procedure

Before starting experiment~

  1. Grab the soil plates that you collected for lab #5.
  2. Perform the non-flooded plate procedure. Add water until the soil is saturated but not flooded.
  3. Let sit for approximately 30 hours.

Once in lab~

  1. Reclaim your petri dish and pull up the numbers you recorded in lab #5 regarding dish weight, soil plus dish weight, and soil weight. These recordings are your ‘wet’ soil data.
  2. In a chart, enter these numbers as well as the numbers from the ‘dry’ soil that were recorded before putting the water into the dish. (For the following steps, I will be using practice numbers because my dish was not weighed prior to the water being added.) Make sure you use the correct number for whether you weighed the dish with the lid on or off. Table 1.
  3. Calculate the percent water. Use the equation: [(wet soil – dry soil) / wet soil] x 100. My numbers are recorded in Table 2.
  4. Now centrifuge 300μl of liquid from the dish. Allow the centrifuge to run for at least 10 seconds and also make sure the dish is balanced by having to samples go simultaneously 180 degrees apart.
  5. Pipette 20 μl of the centrifuged liquid and place on top of the petri dish lid.
  6. Place a strip of pH paper (pH 5-9) directly on top of the drop and allow to sit for at least 15 seconds.
  7. Using the pH scale provided with the pH paper, calculate the pH of the soil extract, and record. Table 2.
  8. Now proceed to observe the soil underneath the dissecting scope and compound scope. To have the best view, grab a pipette and pull off some of the water and shift the dirt around so you have a clear view to the bottom of the petri dish. Break up any obvious clumps in the soil.
  9. Place the dish on the stage of the dissecting scope and begin to search for any ciliates. This will be challenging because the dissecting scope has a low magnification, but search nonetheless.
  10. Once you are sure you have thoroughly searched the dish, pipette 10 μl of the liquid from the top of the dish onto a concavity slide. Try to not pull up any soil, but if you do, no worries.
  11. Start at the 4x magnification. Once you spot a ciliate, use a pipette to distribute the drop into more small drops of liquid. This process is to corner the ciliates into a smaller area in order to use a higher magnification.
  12. Once you have divided the liquid into smaller drops, add a syrup-like substance to the drops to slow down the ciliates, and place a cover slip on top of the slide.
  13. Observe under the compound microscope, take photos, and record findings.Table 3.

Data

Table 1~ Weights

Sample Weight (g) Practice #’s (g)
Empty Petri Dish 11.3 5.8
Petri Dish + Wet Soil 21.2 30.8
Wet Soil 9.9 25
Petri Dish + Dry Soil n/a 22.8
Dry Soil n/a 17

Table 2~ % Water & pH

% Water 32
pH of soil 6.5

Table 3~ Found Ciliates

Approximate # 5
Color Opaque/ White
Shape Oval
Other Fast/ Spastic

Storage

  • The petri-dishes were returned to the fume hood area for storage.
  • Slides and covers were washed and placed on a paper towel to dry.
  • The pop-lid container (the tube used in the centrifuge) containing the liquid from the dish was thrown away after the contents were drained.
  • The pH paper was thrown away; the hand-held pH measure was stored in its box and placed at the end of the table.
  • Microscopes were covered and unplugged.
  • Any paper towels, slide cleaning paper, and disposable pipettes were all thrown away.

Conclusion

As we wrap up our Tetrahymena experiment, we begin our new experiment regarding wild ciliates and their place in the soil ecosystem. This is important because this soil experiment gives us the background information for why our Tetrahymena experiment is important and relevant to all people. Today’s specific lab, showed us that ciliates do exist in everyday life and we proved this by finding ciliates in the soil we collected. As we performed the necessary steps to observe the ciliates, we were able to personally ‘discover’ our ciliates. This experiment allowed us to combine all of our laboratory skills and gave us a great insight into the relevancy of ciliates.

October 26

10/25 Lab 10: Results and Analysis

Print Friendly, PDF & Email

Lab Report Reflection

Abstract~

The abstract section is the general summary of the experiment including some background information, the major ideas and systems that are being tested, as well as a few sentences regarding the conclusion. It is important to have this section because it is the first thing another researcher will see and read to decide if your paper is relevant or helpful to him and his research. For a person who is simply interested in this field, the abstract will give him a nice overview about what they can expect to read in the rest of the paper. It allows people to skip to a specific section, for example the graphs, and not be terribly confused about what the graphs are supposed to project.

Introduction~

The introduction is more specific than the abstract but is still dealing with the broadness of the paper. This section includes some background as to why this specific research is necessary and relevant to the scientific world and gives the purpose to what and why the experiment is being conducted. This section is imperative because once a person goes through the abstract and decides to continue reading, the introduction will give them a firm foundation for what details the rest of paper will entail.

Materials & Methods~

The materials and methods is the first of three large components in the paper itself. This section is the ‘how’ behind the experiment and includes specific details regarding how the experiment is prepared and conducted. This section is important because even though a general person might not be concerned with the materials and methods, a fellow researcher will be interested in what tools are used and why they are chosen as well as the amount of substances that are tested; this allows him to possibly re-conduct the experiment or transfer methods to his own experiment. Also, the materials and methods give the background to what is presented in the graphs, and therefore is crucial to the paper itself.

Results~

The results are the second large component to the paper and this is where- as the title suggests- the results are placed. It includes graphs, captions, and summaries of what the graphs represent. It also includes smaller details like mean, p-value, standard error, etc. The results section is very critical to a paper because after reading the abstract, this section is normally where a reader will jump to because it is the ‘meat’ of the experiment due to the fact that the graphs give a clear and concise visual understanding of what the experiment shows.

Discussion~

The discussion section is the third large component of the paper and it ties the whole paper together in a nice bow. Without being redundant to the introduction, the discussion part touches back on the questions raised in the introduction by comparing them with the results found. This section also calls for more citations to other research articles that either defend the findings or contradict them. This section is vital because this is where the rubber meets the road and the paper shows its relevancy to the real world. It does this by giving good applications and recommendations for future experiments in the specific field or even different fields that would need this information as a background.

Citations~

The citations section is crucial because it validates the whole paper; without this section, the paper would be subject to plagiarism and therefore unusable in the scientific community. Although this section is not normally read in the same sense as the other sections, the citations do allow readers to look at other articles that are related to the topic. Most importantly, this section proves to the reader that the authors really did their research and took the time to compare and contrast other articles in the field, furthering its ethos as a credible paper.

October 19

10/18 Lab #9: Results and Figures

Print Friendly, PDF & Email

Purpose

The purpose of this lab was to continue to compile our data and draw results from what the charts display regarding the effects of PPT on Tetrahymena cells. We worked with Excel and broadened our knowledge of error bars, graphs, and charts. In a broader scope, we continued to work on our end research paper by writing our results section. This lab also posed some hard situations that we learned to overcome, expanding our growth mindset.

Procedure

  1. Open up Excel
  2. You will be creating three charts- 1) cell count, 2) optical density, and 3) your specific assay- so compile the items relating to these topics onto one excel sheet for easy access.
  3. Begin by creating the chart for the cell counts. Create three columns with control, treatment, and original count. Below each title, enter the mean and the standard error (both of these values can be found under the descriptive analysis data you collected last week).
  4. Highlight the titles and their means and then click up to recommended charts. Find the vertical bar graph and select. Make sure to add a chart title and titles for both the x and y axis.
  5. Now add error bars. You can do this by going to “add chart elements” and finding “error bar”, then selecting a custom value. Use the standard error as your input and output. Then check back to the descriptive analysis and see if the F-Critical is bigger than the F value. If yes, then add a * to the top of the bar in the graph. Do this for each sample.
  6. Create a text box underneath the graph and type a short explanation of what the graph is about as well as a graph number (this number is what you will reference in your paper).
  7. Repeat steps 4-6 for the Optical Density and Behavioral Assay that you completed.
  8. Once you have completed all three charts, save them as JPEG files to your computer.
  9. Now move on to your paper. Here, rewrite your Materials and Methods with the comments that came with it in the submission and add the Results section. Make sure to not fall into the Discussion section (we will get there later). Some key points to follow are, DO compare your results, point out key data points, and summarize your charts but DON’T restate your charts or interpret them.
  10. Add your photos into the paper and make sure your paper is coherent and symmetrical.

Data

Cell Count Chart~

Optical Density Chart~

Swim Assay Chart~

Storage

Since we were again in the computer lab, we did not have anything tangible to store. However we did store our charts as JPEG photos. We turned in the cell count and optical density charts as a group for our QTM and turned in our paper draft with the addition of the Results section.

Conclusion

This lab was again very fasted paced which called for a lot of fast thinking, decision, and action. This time-crunch resulted in some complications as we had to re-do a lot of our charts multiple times because we kept remembering more things that should have been added. The error bars proposed a hard challenge but in the end we were able to figure them out and get our charts turned in on time. For the future, I think I will try to understand of all the tasks required of me before I dive in, because my process of working quickly and efficiently, turned into more back tracking than forward progress because more points kept being added that I had not considered the first time through. Overall though, I think we made some good progress in our paper by adding the Results section and we are starting to see the finish line up ahead for the final project turn in and presentation. I look forward to correcting my mistakes and bettering my Excel skills as we close in on our Tetrahymena Experiment.

October 12

10/11 Lab 8: Data Analysis

Print Friendly, PDF & Email

Purpose

The purpose of this lab was to 1) become inept in using Excel and 2) to analyze the data we collected on how polypropylene effect Tetrahymena. We had previously collected our data but this lab was designed for us to sit down and really look at our data and decipher what it tells us. While doing this we were exposed many of Excel’s secrets- such as descriptive analysis and histograms- and applied them to our analysis of our data. Perhaps the most important goal of this lab was to stretch our laboratory skills outside of the actual lab and apply our skills and knowledge to finding answers and becoming more technologically advanced.

Procedure

  1. Opened excel spreadsheet
  2. Combined all the control data into one single column
  3. Combined all the treatment data into one single column
  4. Downloaded the data analysis Excel Pak
  5. Performed the descriptive analysis test for control
  6. Performed the descriptive analysis test for treatment
  7. Performed the F-Test for both
  8. Decided the variances are different because the F Critical one was bigger than the F and chose the T-Test: Two-sample assuming unequal variances
  9. Performed the T-Test: Two-sample assuming unequal variances
  10. Arranged the control and treatment into decreasing order from top to bottom
  11. Performed the Histogram for control
  12. Performed the Histogram for treatment
  13. Re-performed the Histogram for control and selected ‘chart output’
  14. Re-performed the Histogram for treatment and selected ‘chart output’
  15. Moved to swim speed
  16. Typed all the data for control into one single column
  17. Typed all the data for treatment into one single column
  18. Performed the descriptive analysis test for control
  19. Performed the descriptive analysis test for treatment
  20. Performed the F-Test for both
  21. Decided the variances are different because the F Critical one was bigger than the F and chose the T-Test: Two-sample assuming unequal variances
  22. Arranged the control and treatment into decreasing order from top to bottom
  23. Performed the Histogram for control
  24. Performed the Histogram for treatment
  25. Re-performed the Histogram for control and selected ‘chart output’
  26. Re-performed the Histogram for treatment and selected ‘chart output’

Data

Cell Count Data~

bin=cell count

bin=cell count

Swim Speed Data~

bin=sec

bin=sec

Storage

Because we were in the computer lab, there was nothing to store.

Conclusion/ What the Data Tells Us

For the cell count data, it actually shows that more cells were counted with the treatment than the control. The original hypothesis stated that the treatment would hamper the growth of the Tetrahymena, however the opposite was noted. This can be seen easiest through the histogram chart where the control shows that the frequency is higher in bins 8,000 and 12,000 and treatment frequency is highest in the > 32,000. Our hypothesis is disproved and the opposite is noted to be more accurate: Polypropylene enhances Tetrahymena cell count growth. For the swim speed many things can be concluded from the data but the biggest are that 1) the range is larger for treatment and 2) the majority of cells in the control were found to be slower than the majority of treatment cells. These points are best seen through the descriptive analysis for range and the histogram chart for frequency. This again disproves the original hypothesis that the polypropylene would cause the cells to slow; instead, polypropylene appears to speed up the swim speed of the Tetrahymena.


October 5

10/4 Lab 7: Materials and Methods- Performing the Experiment

Print Friendly, PDF & Email

Purpose

The purpose of this lab was to compare and contrast how microplastics affect Tetrahymena as well as perfect our technical skills and add a few more skills to our ‘tool-belt’ of laboratory knowledge. We continued our experiment with the brown baling twine polypropylene (PP) by comparing results of the PPT (clean media), PPT and TJ (twine juice), PPT and TH (Tetrahymena), and PPT plus TJ plus TH. These experiments required precision of basic skills such as pipetting and microscopy. In addition, these experiments required us to expand our realm of knowledge to serological pipetting and spectrophotometers. All in all, through the different elements required by the lab, we were able to directly see how Tetrahymena were affected by polypropylene.

Procedure

Prior to coming to lab~

  1. Boil the TJ to mimic the elements that brown baling twine naturally undergo.
  2. Filter using 5μm filter paper.
  3. Add PPT media to all TJ jars so they all have the same concentration of .5g/50ml or 1%.
  4. Autoclave the TJ to kill any bacteria or microbes for 15min at 121 degrees Celsius.
  5. Add 5ml of 6.1×10^4 cell/ml Tetrahymena culture to 45ml of media to create a 1:10 dilution.

Done in lab~

  1. Grab your table partner who also completed the same assay as you in last week’s lab, this is the person you will complete the lab with.
  2. Aseptically transfer 4ml of treatment and 4ml of control into sterile glass tubes using a serological pipette. Pointers for accomplishing this: swirl the flask containing the culture before pipetting, pipette from around the top of the culture, keep your test tubes labeled and covered, and USE A TEST TUBE RACK (so you do not drop them:)
  3. Carry your obtained tubes to the spectrophotometer where you will measure Optical Denisty (OD) at 600nm (this wavelength is somewhere in the yellow-orange emitted light). Measure the absorbance for PPT, PPT+TJ, PPT+TH, and PPT+TJ+TH. Record your measurements. TABLE 1.
  4. Now return to your table where you will calculate the cell count for the control and treatment.
  5. Obtain two slides (does not matter if they are concave or not) 1 slide for the control and 1 slide for the treatment. Count 3 drops for control and 3 for treatment using 2μl of Tetrahymena and 1μl of iodine. I counted for the control drops and Mackenzie counted for the treatment. TABLE 2 & 3. 
  6. Calculate the concentration of the control and treatment cultures. Start by taking the mean of the number of cells for one slide, then divide that number by 3μl, then multiple by the dilution factor (1.5), and then multiple by 1000μl/ml. My equation for the control culture looks like this: (27.3cells/3μl)x(1.5)x(1000μl/ml)=13,650cells/ml.  My equation for the treatment looks like this: (50cells/3μl)x(1.5)x(1000μl/ml)=25,000cells/ml
  7. Now you and your partner will perform the same assay you both did last week. Mackenzie and I did the swim speed assay. (Madison did the vacuole formation and Lauren did the change in direction)
  8. For the swim speed assay, prepare a slide with 20μl of control and another slide with 20μl of treatment. (For easy measurements, we used the compound microscope that has a built in ruler).
  9. Locate a cell moving relatively straight. Decide how long of a distance you will time the cell for. We chose the 50mm and the 60mm. Once the cell passes the mark, start the timer, then stop it as soon as it passes the other mark. Perform this 10 times and record your values.
  10. Now calculate the cells actual speed for the control. Based on the FOV being at 40 and having approximately 180 marks shown, we calculated the value of .02mm/mark. For each cell time, divide .02 by the seconds. For example, a time of 1.05 sec will be: .02/1.05=.19mm/sec. TABLE 4.
  11. Repeat step 10 for the treatment, using the same order and procedure. TABLE 5.

Data

Table 1~ Absorbance

Culture Absorbance
PPT 0
PPT+TJ 0.072
PPT+TH 0.01
PPT+TJ+TH 0.077

Table 2~ Cell Count Control

Slide Cell #
1 35
2 29
3 18

Table 3~ Cell Count Treatment

Slide Cell #
1 50
2 70
3 30

Table 4~ Swim Speed Control

Control Time(sec) Speed(.02/sec)
cell 1 1.05 0.19
cell 2 0.93 0.22
cell 3 0.93 0.22
cell 4 0.95 0.21
cell 5 0.93 0.22
cell 6 0.9 0.22
cell 7 1.35 0.15
cell 8 1 0.2
cell 9 1.21 1.21
cell 10 1.32 1.32

Table 5~ Swim Speed Treatment

Treatment Time(sec) Speed(.02/sec)
cell 1 0.7 0.29
cell 2 0.76 0.26
cell 3 0.61 0.33
cell 4 0.62 0.32
cell 5 0.53 0.38
cell 6 0.48 0.42
cell 7 0.55 0.36
cell 8 0.19 0.19
cell 9 0.22 0.22
cell 10 1.15 0.17

Storage

All microscopes were unplugged and covered up.

Slides were washed and placed on the paper towel to dry.

The tubes of culture were saved for open lab so they were placed in the tube rack and set next to the flask of culture.

Pipette tips were discarded into the cup.

Pipettes were placed on the stand.

The table was cleared.

Conclusion

This lab was pivotal in our experiment because we started working on our methods and materials section and given the opportunity to expand our knowledge of lab skills. Due to the natural time crunch of our lab, we were expected to work diligently and precisely. This gave us the extra push we needed to dig deeper into our research. We executed the lab skills that we have been practicing with more speed. We also quickened our turn-around speed of going from learning to practicing with the serological pipette and spectrophotometer. All in all this fast paced lab encouraged us to continue with our research even under stressful conditions. These skills can be transferred to many different aspects including studying, working, and even complex thinking.

September 28

9/27 Lab 6: Experimental Design and Preparation

Print Friendly, PDF & Email

Purpose

The purpose of this lab was to hone in what our experiment as a class will be as well as to get lab protocol down before we delve into the actual experiments regarding Tetrahymena and microplastics. We also learned more regarding the behavior of Tetrahymena using different assays testing aspects such as swim speed, directional changes, and lysosomal ingestion. In addition to these specific purposes, we are always working to further develop our lab skills making them faster and more precise as well as to dive deeper into what our data actually represents and how we can apply that data (discussed more in conclusion section).

Procedure

  1. Start with the PP Microplastic Production.
  2. You will find it easier to tare the balance with a provided small tin holder on top to make the tin become your new ‘zero’. This will make calculating the mass of twine much easier.
  3. Cut the brown polypropylene twine into small pieces with scissors.
  4. Place the twine pieces into the tin holder until the scale reads .5 g.
  5. Transfer the .5 g of PP into a sterile glass jar.
  6. Now obtain 50ml of sterile proteose-peptone-tryptone (PPT) media.
  7. Add this amount to the jar and swirl around.
  8. Place the jar in the microwave where it will be boiled and filtered for 1.5 hours. This liquid will be used in later weeks.
  9. Now move on to your next experiment. Add 20μl of cells to a 5μl Iodine onto a cap lid. Use the P200 micropipettor to pipette the Tetrahymena and use the P20 for pipetting the Iodine onto the Tetrahymena drops. (Also beware of the Iodine as it will stain.)
  10. Once the drops have been prepared, grab 3 concavity slides. Using the P20, pipette 5μl of each drop into three separate drops on one slide. This will result in 9 new drops total, 3 new drops each made from the original drops. Each slide will have 3 drops on it.
  11. Pull out a compound microscope and begin to look at each drop for each slide. Note the number of cells present and record. Table 1. You might find it easier to take a picture of the slide via Snapchat so you can put a red dot on top of each cell as you count. This will result in fewer systematic errors (talked about more in the conclusion section).
  12. Repeat step 11 for all 9 drops.
  13. Now decide between your lab partners who will take command of which slide. I took control of slide 1 and that is what I will be referring to in the upcoming steps. (Lauren took slide 2 and Madison took slide 3)
  14. Calculate the concentration of the slide. Use the equation: (Avg # of cells/5μl) x (dilution factor) x (1000μl/ml). My equation came out as this: (311 cells/5μl) x (1.25) x (1000μl/ml) = 77,750 cells/ml
  15. Now you move on to your final experiment involving Assays. There is a Swim Speed Assay, Percent Directional Change Assay, and Lysosomal Assay. You will split these among your lab partners and I chose Swim Speed. (Lauren took Percent Directional Change and Madison took Lysosomal Ingestion).
  16. For this experiment, you will need a dissection microscope, your phone, and a clear ruler.
  17. Begin by obtaining 20μl of Tetrahymena. Use the P200 and pipette the drop onto a FLAT slide.
  18. Place the ruler onto the stage of the scope and then place the slide on top of the ruler.
  19. Adjust the scope to visualize the cells.
  20. Turn on the stopwatch of your phone and hover your fingers over the START and LAP button.
  21. Looking into the scope, find a cell that is going in a relatively straight line and note when it passes each mm mark on the ruler. Every time the cell passes a mark, click the lap button. (If the cell changes direction, quickly spot another cell that you can follow that is in a similar spot as your previous cell.
  22. Once you have hit the lap button 10 times, look at the times and record the values in the table. Table 2. 
  23. Congrats you have now finished all your experiments!
  24. Clean up your work area and slides and put away anything you borrowed or used.

Data

Table 1

Slide Drop Cell Count
1 1 117
1 2 79
1 3 736
2 1 101
2 2 117
2 3 314
3 1 1
3 2 33
3 3 446

***numbers in red are SLIDE #. DROP #

Table 2

Cell Time(sec)
1 2.45
2 2.38
3 2.96
4 2.75
5 2.83
6 2.29
7 2.63
8 2.35
9 2.64
10 2.23

Storage

  • The twine juice was stored in the microwave for boiling and then kept in the back of the lab for later usage.
  • The extra twine was thrown away.
  • The Tetrahymena was stored in its small hinged lid container and placed in the holder at the end of the table.
  • All of the microscopes were unplugged and recovered.
  • All slides were washed with water and placed on a paper towel next to the sink to dry.
  • The samples were closed up and set in their stands.
  • The micropipettor tips were discarded in the cup and the pipettes were placed on their stands.

Conclusion

This lab was very interesting and quite enjoyable because we got the opportunity to combine all of our lab skills and apply them in a very rewarding way. The twine experiment tested our ability to know substances and then how to combine them to break down the twine thus that we can experiment on the juice on a microorganism level. I look forward to seeing how the Tetrahymena present responded to the exposure of polypropylene. Of course, seeing the end product requires us to know the beginning which is where the behavioral assays came into play. The tests that we ran gave us a great look into the normal behaviors of Tetrahymena. I specifically looked at the swim speed and it was fascinating to see how fast those little guys move! Using the data that I (along with my lab partners) obtained, I can compare the behaviors of Tetrahymena before exposure to polypropylene and after to conclude how microplastics affect our soil system. On a different- yet still related- note, was how we distinguished between random errors and systematic errors and how to minimize both in our experiments. First, we concluded that systematic errors are those that can be controlled; for example, having everyone on the same page for instructions, procedure steps, and samples. Random errors are the ones that you cannot control such as air temperature affects. In order to minimize these, it is always best to confirm everyone is on the same page and to control the external variables to the best of your abilities. These lessons that we learned during this lab will aid us as we continue on to bigger experiments as a class.

September 21

9/20 Lab #5: Experimental Design and Serial Dilutions

Print Friendly, PDF & Email

Purpose

The purpose of this lab was to LITERALLY get a hands on experience in our own experiments. We collected our own soil to prepare for our future experiment. In addition to the actual collection, we also started the design of our current experiment involving Tetrahymena and microplastics. The purpose of all of this hands on procedure is to really take a hold of our own education and experiments. The LA, TA, and Professor have taught us the necessary skills required including article research, lab technique, and critical yet creative thinking. This lab is the opportunity to put it all together and begin the trek to scientific experiments and research.

Procedure

  1. To start your soil collection, begin by gathering all the materials you will need. This includes: a sandwich bag, spoon, sharpie, and phone.
  2. Now go to your designated area (provided by your instructors) and choose a tree.
  3. Begin by taking photos of the tree as a whole, the leaves of the tree, and the area next to the roots where you will dig. Once you have these documented, start digging. (Remember to stay on the superficial dirt level because Tetrahymena need air.)
  4. Once you have filled close to half of the bag, take a picture of your collected soil. You will upload this photo as well as the ones taken in procedure 3 into a survey. Also in the survey, you will be required to calculate a few measurements regarding the tree, so using the photo you took of the tree estimate to the best of your abilities the diameter of the tree trunk in cm (both at its widest and narrowest points), the diameter of the canopy of the tree in cm, and the height of the tree in m. After recording these values, drop a pin of exactly where your tree is on the map provided. Congrats! You have now finished the soil survey!
  5. When you show up to lab, weigh your provided petri dish, then fill the dish with soil and weigh that amount. You can also calculate the weight of the soil by subtracting the two numbers. Record these values. *Table 1 (the soil part is over and you will not return to it for a couple of weeks to allow for the Tetrahymena to encyst.)
  6. Now you will move on to stock Tetrahymena. Obtain your pre-prepared 24-well plate that contains the stock solution. Observe it under the dissecting microscope at 4 power and with a black plate set on the base. Take a picture of what you see. Put away the dissecting microscope and set up a compound microscope.
  7.  Using the P20 micropipette,  pipette 5 μl of culture onto a concavity slide. Observe at 4x mag and then shift to 10x mag. Take pictures at each mag. Once you are done, wipe off the slide with slide cleaner paper.
  8. Now you will begin the dilutions. Using the P1000 micropipettor, pipette 900μl of Tetrahymena culture media to four wells in the well plate (label these four wells as 10^-1, 10^-2, 10^-3, and 10^-4).
  9. Change to the P200 and pipette 100μl of stock culture into the 10^-1 well. Mix the well slowly using the pipettor. CHANGE TIP.
  10. Now you will pipette 100μl of 10^-1 into 10^-2. Mix slowly and CHANGE TIP.
  11. Repeat step 10 two more times transferring from 10^-2 to 10^-3 and then 10^-3 to 10^-4.
  12. Use the P10 to pipette 5μl of the 10^-1 well onto a concavity slide and observe under the 10x mag of the compound microscope. Record in the table the number of cells you see. Then divide that number by 5. Then multiply that number by the dilution factor. Finally multiply that number by 1000 to get the final solution. The equation looks like this:                             (#of cells/5μl) x (dilution factor) x (1000μl/ml) = concentration of stock culture in cells/ml Table 2 is the results that I found and calculated. Take any desired pictures.
  13. Repeat step 12 two more times. I did mine with 10^-2 and 10^-4. Make sure to wipe the slide off each time with the slide cleaner paper. Also discard the pipette tip after each time. This will ensure that no Tetrahymena crossed over dilutions.
  14. Once you have finished with the 10-fold serial dilution, unplug and cover your microscope, wash the slide with water and let it dry on a paper towel.
  15. Make sure your work space is clean and everything is properly put away in its respective places.
  16. Now move upstairs for the computer lab. Get with your team and begin thinking about the experiment you want to perform.
  17. Record you question and hypothesis.
  18. Describe your methods of how you plan to treat and experiment. (Step 17 and 18 can be found in the data section under the title Experimental Design)
  19. Now make a table that resembles a 24-well plate and label what you would name each section. Table 3
  20. Congrats! You finished! Remember to turn your paper in and make sure your space is clean.

Data

Table 1

Dish 11.3 g
Dish & Soil 21.2g
Soil 9.9 g

Soil Photos

Table 2

Trial Dilution Cell count in 5μl Cells per μl in drop (÷5) Cells/μl in undiluted sample (x dilution factor) Cells/ml in undiluted sample (x1000 μl/ml)
1 10^-1 5 1 10 10,000
2 10^-2 1 .2 20 20,000
3 10^-4 0 0 0 0
Average 10,000

Tetrahymena Photos

Dissecting  4x 10x       10^-2

Experimental Design

Question: If Tetrahymena is introduced to the soil surrounding Lake Waco that has been exposed to Styrofoam, will the Tetrahymena bring the soil to a neutral pH?                                        Hypothesis: If Tetrahymena is introduced to the Styrofoam infected soil, it will neutralize the soil’s pH to the desired range of 5.2-7.3.                                                                                                       Methods: there will be three groups: one control with the normal soil sample (no added Styrofoam or Tetrahymena), one tested group with Styrofoam added, and one with Styrofoam and Tetrahymena. The pH will be calculated with a pH meter at the beginning for each group, then again after one week, and finally after one month.

Table 3

1 2 3 4 5 6
A

1 WEEK

Control soil

1 WEEK

Control soil

1 WEEK

Styrofoam

1 WEEK

Styrofoam

1 WEEK

Styrofoam & Tetrahymena

1 WEEK

Styrofoam & Tetrahymena

B

1 WEEK

Control soil

1 WEEK

Control soil

1 WEEK

Styrofoam

1 WEEK

Styrofoam

1 WEEK

Styrofoam & Tetrahymena

1 WEEK

Styrofoam & Tetrahymena

C

1 MONTH

Control soil

1 MONTH

Control soil

1 MONTH

Styrofoam

1 MONTH

Styrofoam

1 MONTH

Styrofoam & Tetrahymena

1 MONTH

Styrofoam & Tetrahymena

D

1 MONTH

Control soil

1 MONTH

Control soil

1 MONTH

Styrofoam

1 MONTH

Styrofoam

1 MONTH

Styrofoam & Tetrahymena

1 MONTH

Styrofoam & Tetrahymena


Storage

The soil that was collected was put into a petri dish and stored under the fume hood. Mine was labeled REW34F18. The remaining soil was kept in its bag and placed in a bin.

The Microscopes were unplugged, covered, and placed back in their homes.

The micropipettor tips were discarded and then placed back on their rack.

The concavity slide was washed with water and left on a paper towel to dry.

The 24-well plate, the black plate, and media were all covered back up and placed neatly either at the end of the table or in the middle where they were found.

Conclusion

I am looking forward to many things. The soil experiment will be exciting to see if I did in fact collect some Tetrahymena. I am most looking forward to the dehydration and re-hydration of the samples because it will involve the Tetrahymena actively conforming to their environment and hopefully they are preserved so we can see them. In addition it will be exciting to look how Tetrahymena are a part of our everyday life. After seeing them under the microscope and then realizing they were collected only a few yards away really brings them to life. Also with the microplastics experiment, I am looking forward to seeing if Tetrahymena really do in fact help maintain the pH of soil even with the affects of microplastics like Styrofoam. Both of these experiments will provide a hands-on personal experience of the role that Tetrahymena play in our lives. I look forward to both of these experiments coming to fruition and how I can help in the furthering of Tetrahymena research.

September 14

9/13 Lab #4: Primary Literature and Experimental Design

Print Friendly, PDF & Email

Objective/Purpose/Rationale

The purpose of this lab is to hone our abilities of using a pipette, to explore how to use a micropipettor, to further study Tetrahymena under the microscope as well as in literature, define creativity in scientific universe, and to begin our adventure in proposing and conducting our own experiment regarding Tetrahymena and microplastics. Through this lab we also continue to importance of laboratory mannerism including communication, safety, and general techniques.

Materials

  1. NEW dissecting microscope (yay)
  2. Prepared well of Tetrahymena specimen
  3. Micropipettor ranging from .5-10 μm
  4. Black plate
  5. Compound microscope
  6. Concavity slide and slide cover

Procedure

  1. Begin by obtaining your well containing Tetrahymena, a black plate, and dissecting microscope.
  2. Uncover and plug in the microscope.
  3. Place the black plate on top of the base covering the light.
  4. Turn up the light emitted from the top to be able to observe the organisms.
  5. Start examining the organisms on the 2.5x magnification and take a picture. (You do not have to choose this magnification, this is just where I found the clearest picture, however my lab partners found their organisms at different magnifications.)
  6. At this point you unplug your dissecting microscope, cover it up, and transition to your compound microscope. Uncover and plug it in.
  7. Using the P-10 micropipettor, obtain 5μl of Tetrahymena from the well.
  8. Transfer the specimen to a concavity slide making sure to use proper pipette technique. (Only push down to the first stop and then release when obtaining the organism and then when depositing onto the slide, push all the way to the second stop; this will allow for all of the specimen to exit)
  9. If your LA offers you a slide cover, take it and place it on top of the slide at an angle to make sure that the Tetrahymena is not squished.
  10. Place the slide on the stage and begin searching for the organism on 4x magnification and take a picture.
  11. Once you have a clear sight of the specimen, record the approximate number of cells you see in your field of view. Record this value.
  12. Now you will approximate the diameter of a Tetrahymena by using the FOV measurements from last week’s lab. Last week I calculated that the 4x magnification was 4.5mm in diameter so in order to calculate the diameter of a single cell, I divided the FOV by the number of cells. This was my calculation:                                                                                                    4.5mm/ 100cells= .045mm/cell
  13. Repeat for 10x magnification using 1.8mm as the FOV from last week’s calculations. For my calculations I did:                                                                  1.8mm/ 50cells= .036mm/cell

Procedure on Computer

  1. Start your time by understanding microplastics. We specifically looked at statistics of how microplastics are taking over whole rivers and areas and potential effecting soil. (The thing I found most interesting in these statisicts is that microplastics are growing at an exponential rate so stopping the growth will be challenging the longer we wait.)
  2. Once you are properly educated about microplastics and their astounding effects, start your research.
  3. Go to PubMed and search for articles relating microplastics to Tetrahymena.
  4. Record the titles and authors of your chosen articles.
  5. Then write down any hypotheses or question you have regarding Tetrahymena and microplastics in soil. My hypotheses/questions revolved around if Tetrahymena are being affected by toxic microplastics and if those toxins are changing the Tetrahymena shape or general function/movement.
  6. Going off of these questions and hypotheses, begin writing down a potential experiment you would like to conduct. My partner Madison and I would like to experiment with different soils and different toxins.
  7. Once you have a general idea for an experiment, write down what data you plan on collecting. We plan to have a control group where just test the starting toxicity and size of the Tetrahymena and then an experimental group where we will purposefully expose Tetrahymena to toxic microplastics and see how the Tetrahymena respond.
  8. Record all of this and turn your paper into your LA and close down your computer.

Storage

  1. Unplug and store all microscopes.
  2. Cover them with their respective cover.
  3. Wash all slides and slide covers with water.
  4. Leave them to dry on a paper towel.
  5. Put back pipettes onto pipette stand.
  6. Discard pipette tips into cup.
  7. Stack the black plates and set them on the end of the table.
  8. Re-cover the well tray with the Tetrahymena sample and place at the end of the table.
  9. For the computers, close out of sites and log off.

Data/Observations/Results

As shown by the pictures, the Tetrahymena became more and more clear as the magnification increased. The Dissecting microscope showed the organisms better with the black plate rather than the light from the blank stage. Also the number of cells was my approximate count of the cells; I tried to count them as best I could but of course there is probably some error.

Mag Number of cells Approximate diameter
4x ~100 TNTC 25mm
10x ~50 TNTC 27.8mm
40x ~35 77.8mm

Conclusion/Next steps

This lab had a lot going on so it required organization and communication. I was able to continue practicing with the microscopes and even got to learn how to work the new dissecting microscopes (again yay). More importantly, I learned how to work a microscopic pipette and this skill will come in handy for future labs where I am required to transfer a small amount of specimen as well as in other labs. For example, in my chemistry lab I have to pipette and now I have so much more knowledge and experience with this skill to be able to perform these experiments to the best of my abilities. Out side of lab I learned just as much. Through the pre-lab and lab research, I have learned what articles I need to look for when researching and how to use the article in an experiment atmosphere, taking the ideas the article poses and then transferring them to other questions I have regarding Tetrahymena and microplastics. I am also excited to begin the experiment that Madison and I have developed. I think the data about how microplastic toxins affect the organisms (especially Tetrahymena) could really raise awareness and alert to how microplastics are affecting our soils.  I know this experiment will be difficult but I believe that with the help of Dr. Adair, our LA, and TA, our results could be beneficial and necessary.