November 15

Bio Lab 13: Ciliate Isolation and Characterization

Print Friendly, PDF & Email

11/13/18

Bio Lab 13: Ciliate Isolation and Characterization

Purpose: In this lab students calculated the soil composition of soil samples and continued isolating ciliates. Students found the percent compositions of sand silt and clay within their soil. Also, students isolated any ciliates that were found and characterized them based off of their appearance and behavior.

Procedure:

  1. Obtain soil composition sample and measure with a ruler in cm the sand, silt and clay portions. (record the percent compositions of each)
  2. Obtain wet soil sample in the petri-dish and add water if it is too dried out.
  3. Add about 5, 5 ul drops of the sample to a concavity slide and place under a compound microscope.
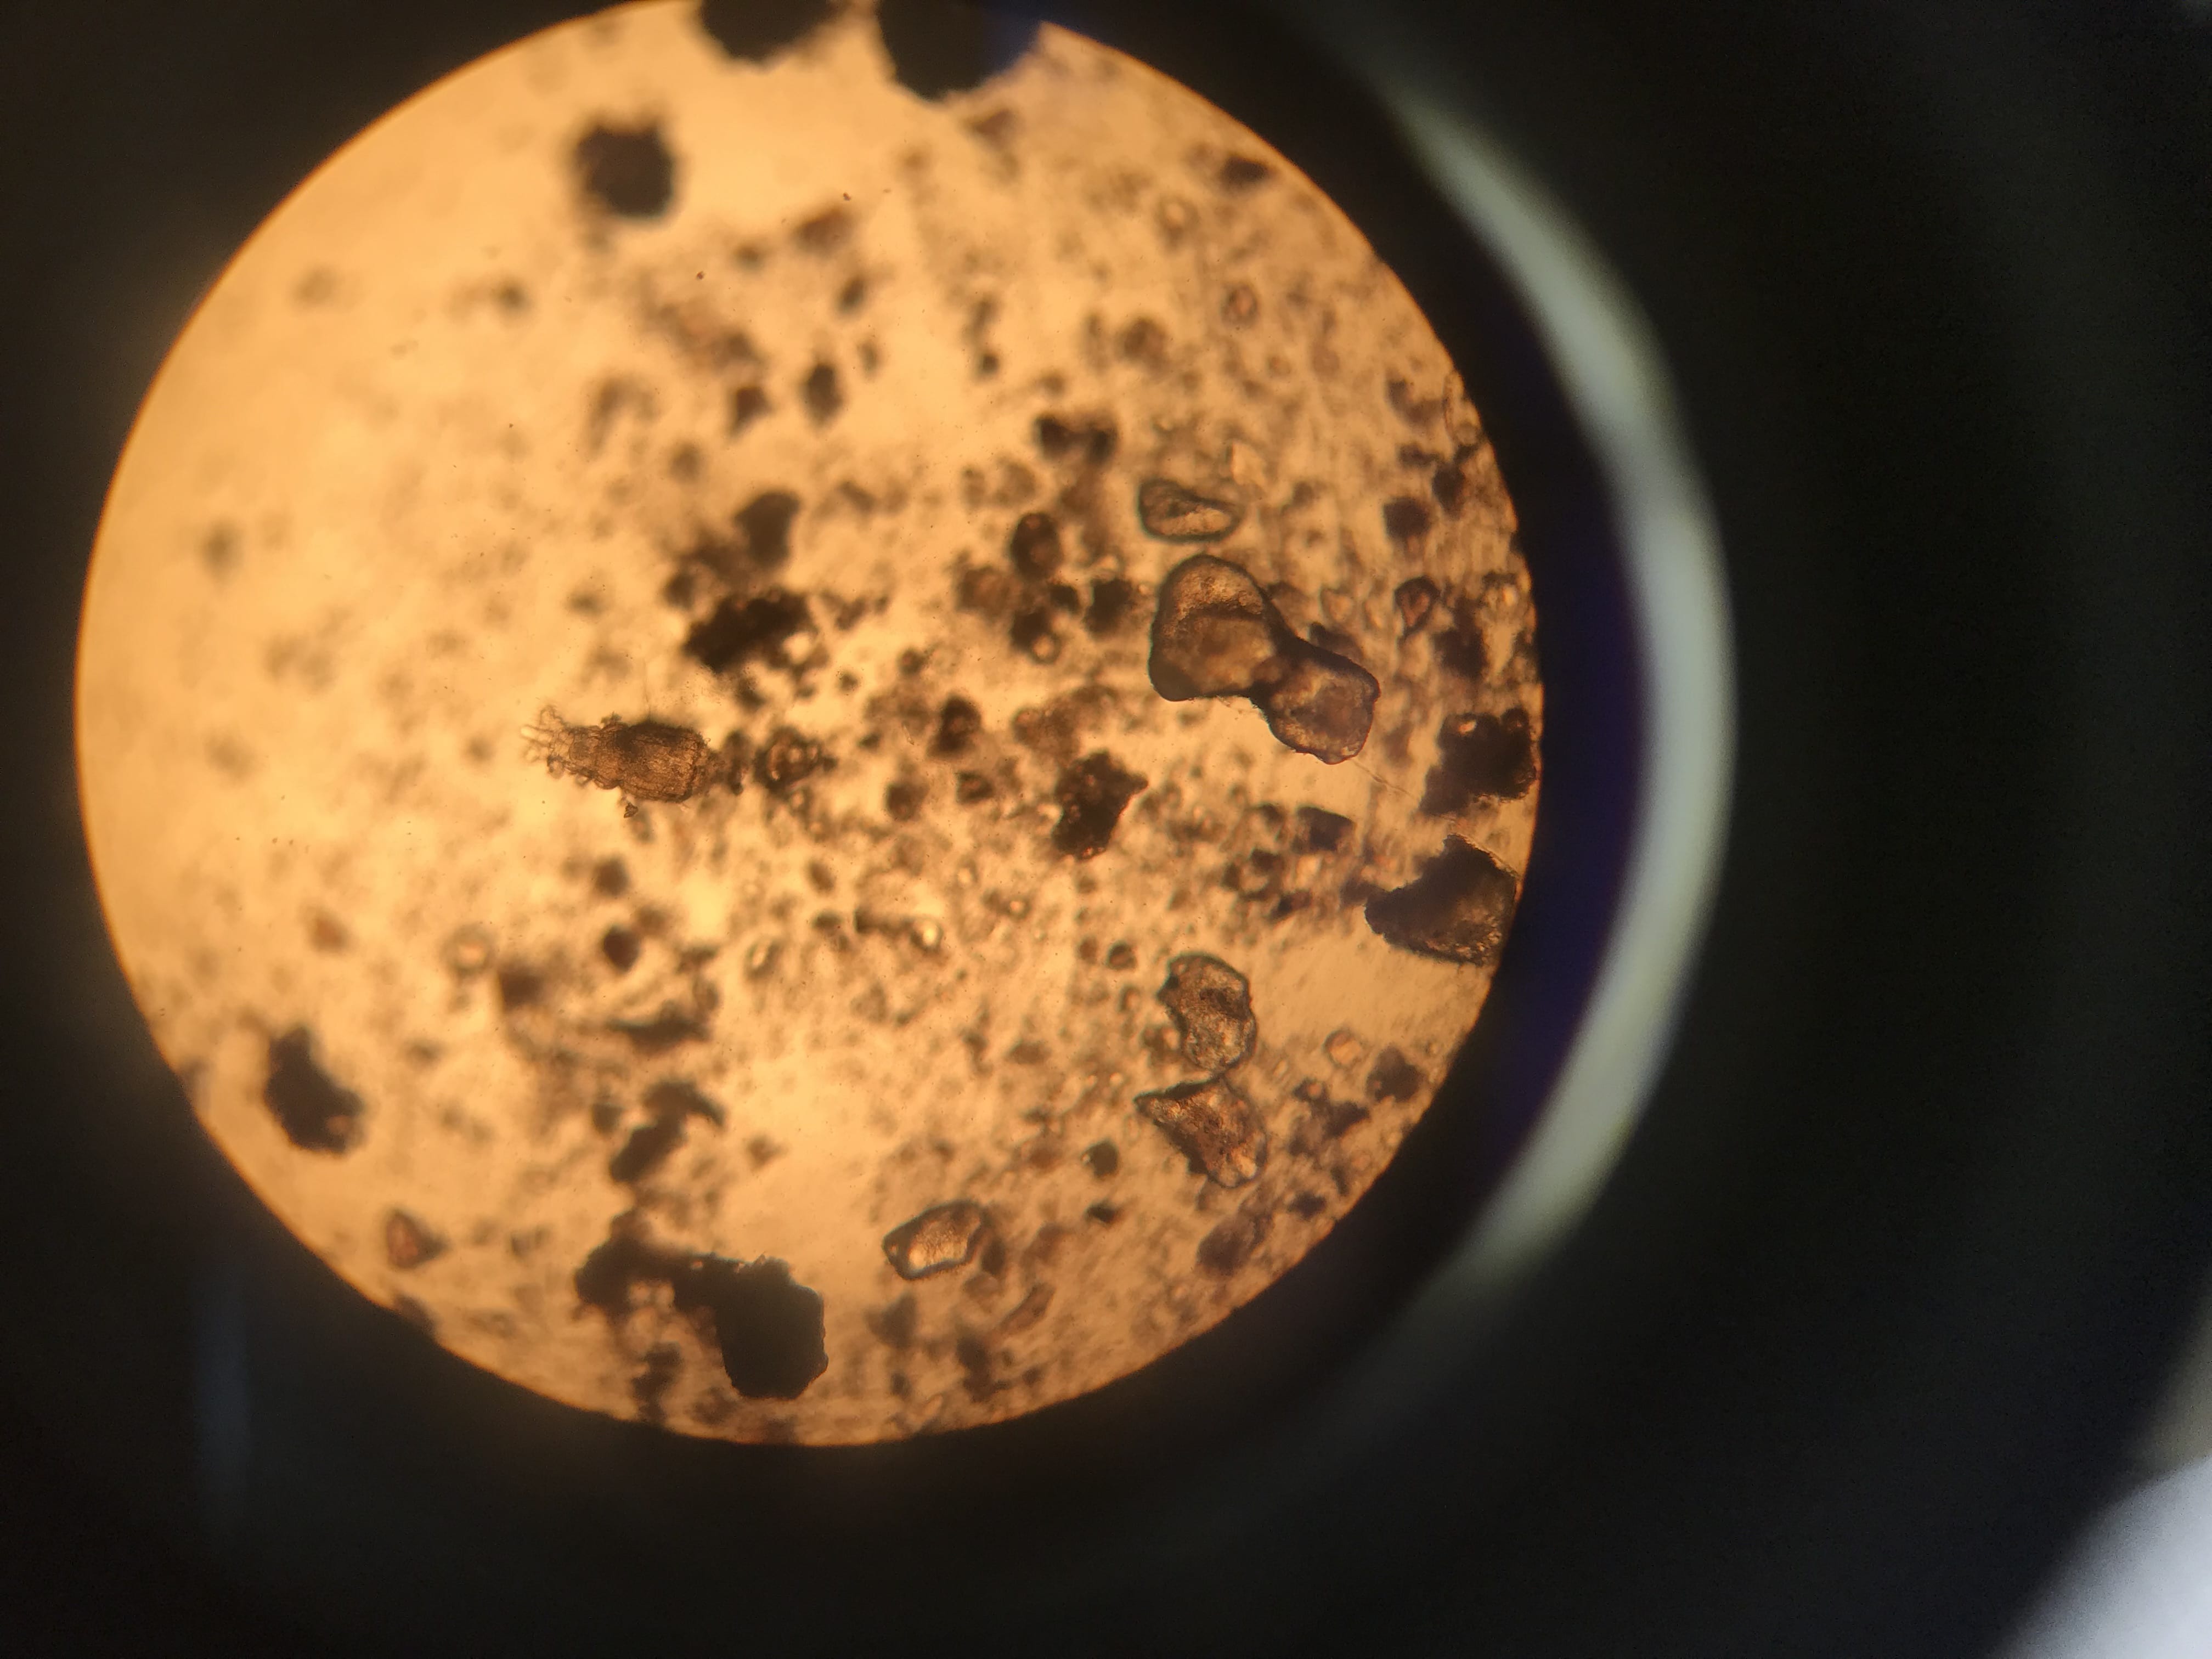
  4. Once a ciliate is located, add a drop of methyl cellulose to the drop of soil sample to slow it down.
  5. Get pictures or videos of the ciliates if possible.
  6. Next, talk with lab group and plan out final presentation of soil ciliates found.

Data: Soil Composition

Sand: 1.5/2.3= 65%

Silt: .5/2.3=22%

Clay: .3/2.3= 13%

Soil texture: Sandy Loam

Storage: Identifier for falcon tube and petri-dish – mo34f18

Conclusion

In this lab I was able to learn more about the characteristics of ciliates and how to identify them, also the different functions that they carry out that are different from other classes of organisms. Also in this lab I calculated the composition of sand, silt and clay in my soil sample and I was able to use this data to find the texture of my soil which was sandy loam. There was 65% sand, 22% silt and only 13% clay in my soil sample. In addition, II was unsuccessful in isolating additional ciliates. I did find one in my first round of sample drops however when I slowed it down with methyl cellulose I lost it. My lab group also discussed what will be in our final presentations of our ciliate discoveries. Two out of the three of us were successful in finding ciliates over the passed three labs. In the future I hope to learn more about different classes of organisms and how ciliates compare to them.

November 8

Lab 12: Ciliate Classification

Print Friendly, PDF & Email

11/8/18

Lab 12: Ciliate Classification

Purpose: The purpose of this was to locate ciliates in the soil sample and classify them based on a variety of characteristics. Also, students learned all about the morphology and classification of ciliates throughout the lab. In addition, students prepared a soil sample for the soil sedimentation test that will be done in the next lab.

Procedure:

  1. To prepare for the soil sedimentation test, label a falcon tube with an identifier and add 4 mL of dry soil into a falcon tube
  2. Fill 6 more mL of the tube with water
  3. Add 2% of sodium pyrophosphate (texture disperser) to the tube and place the falcon tube on the vortex for about 10 seconds.
  4. In order to locate ciliates from the wet soil sample, place the petri-dish of wet soil under a dissecting microscope to see if any ciliates can be found.
  5. If too much water has evaporated from the petri-dish add a small amount of water into the petri-dish.
  6. Take 3 uL drops of the wet soil sample and place them separately on a concavity slide
  7. If any ciliates are found record their characteristics and try to classify them.
  8. Clean area and return soil samples to original location.

Data:


Storage:

Soil samples were stored in petri-dishes labeled: mo34F18 and falcon tubes labeled mo34F18

Conclusion: In this lab I prepared my soil sample for the soil sedimentation test that will be done during next lab and I successfully found ciliates in my soil sample. Although these were the same samples used in the last lab, I was able to find many more ciliates this time along with a rotifer that was very active in the sample. I did have to add more water to the petri-dish since a majority of it had evaporated; this allowed me to obtain better samples of soil which had more ciliates. I was unable to look closer at its specific characteristics as they all moved so quickly around in the sample.  Also in this lab I learned about ciliate morphology and new characteristics about the soil ciliates. Next lab we will use the prepared samples of soil for soil sedimentation and analyze their clay, silt and sand characteristics. I hope to be able to look closer at ciliates next time as well as learn about how clay, silt and sand effects the soil samples and ciliates. 

November 2

Lab #11 Soil Ciliate Discovery and Soil Metadata

Print Friendly, PDF & Email

11/1/18 Lab #11: Soil Ciliate Discovery/ Soil Metadata


Purpose: In this lab students learned about pH and soil ciliates. Students found the pH of the wet soil sample and found the water content of the sample as well. Also, the wet soil sample was observed under a microscope in order to find ciliates in the soil sample.

Procedure:

  1. Obtain mass data of the dry soil sample from lab #5 and obtain the wet soil sample.
  2. In order to find the water content of the soil sample, use the water content formula and the masses of the wet and dry soil sample.
  3. Saturate the dry soil being careful not to flood, in the petri-dish with distilled water creating a non-flooded plate. (step was done 30 hours before lab)
  4. To find the pH of the sample, transfer 1000 microliters into a centrifuge tube and place it in the centrifuge for about 30 seconds.
  5. Let the soil settle and then take 20 microliters and transfer it to the lid of the petri-dish.
  6. Take a small strip of pH paper and submerge it into the drop of soil sample, add another small drop on the pH paper to fully submerge it. Wait one minute before comparing the colors of the pH paper.
  7. Compare the result color of the sample to the pH guide and find the color that matches best. (Record pH)
  8. Next, observe the sample under a dissecting microscope by placing the petri-dish under the microscope and recording observations.
  9. Then, take 10 microliters of sample and place it on a concavity slide. Observe under a compound microscope for ciliates. ( This step may need to be repeated multiple times taking different types of samples in order to find moving ciliates.) Take pictures and record observations.
  10. Clean slides and put away microscopes.


Data:

Mass of Empty Petri-Dish 5.8 g
Mass of Petri- Dish + “wet” soil 27.7 g
Calculate mass of “wet” soil 21.8 g
Mass of petri-dish + Dry soil 24.9 g
Calculate mass of dry soil 19.1 g
pH of dry soil 7.0


Water Content:

  • Formula: Wet soil – dry soil/ wet soil X 100
    • 21.8- 19.1/ 21.8 X100 = 12.4 % water

Storage:

Soil samples were stored in petri-dishes labeled: mo34F18

Conclusion:

Throughout this lab I found the water content and pH of the dried soil sample that I collected a few weeks ago. The water content was 12.6% and the pH was neutral, 7.0. My sample had a lot of soil and not much empty space in the petri dish which made it hard to observe any ciliates in the petri-dish on a dissecting microscope. However after trying over 4 times, I was able to locate a few ciliates on a concavity slide using a compound microscope on magnification 40x. The ciliates appeared small and round moving very quickly. Overall, I was successfully able to observe ciliates within my soil sample and learn how to find water content and pH level. In the future I hope to be able to further analyze soil ciliates and learn more about there function and specific characteristics.

October 25

Lab #10: Reflection

Print Friendly, PDF & Email

10/25/18

Lab Notebook 10 Reflection

Purpose: The purpose of this lab is to gain constructive criticism on the figures presented to the class. In the lab, students also learned about which items and details of the experiment go in each section of a research paper and the purpose of each.

Abstract: The abstract includes a short overview of the article in under 250 words. It should not include any details or any reference to citations. It should only include some background, purpose and basic information of the methods and important results. Lastly the abstract should end in a short conclusion. The purpose of the abstract is to give the reader of the article an overview of what is going to be talked about.

Introduction: The introduction should include a solid background on what the experiment is about. The introduction should also be in the form of an argument while referencing other sources to aid in describing the background of the experiment. The information in the introduction also needs to inform the reader of the importance of the article. The purpose of the introduction is to give the reader a good idea of the purpose for the experiment as well as some information that will be useful in being able to understand the rest of the article.

Methods and Materials: The materials and methods give the procedures of each task done throughout the experiment. The materials and methods should explain in detail what was done in each task giving each measurement and material used. No results or analyses of any information should be included. Lastly, this section should be written in the past tense. The purpose of the methods and materials is to inform the reader of the materials used and procedures followed that lead to the results. 

Results: The results section should be written by going off of the materials and methods section in order to describe the results of each task done. The results should start by giving an analysis of each figure and also include each figure in this section. The narrative of the results should refer to the figures and describe what they are demonstrating. No interpretations or conclusions should be made or discussed in this section. The results should strictly include information about what each figure is conveying. You should be sure that each figure is easy to interpret, concise and correct and include descriptive captions. The statistical analysis should also be included and explained for each figure. The “n” values should be included in the figure captions to correctly explain what the figures are showing. The purpose of the results is to inform the reader of what each figure is showing without discussing any conclusions. 


Discussion: The discussion talks about the significance of the results and what they mean from a general standpoint. This section should also compare information with other research from outside sources. The discussion should include other important questions or suggestions for future experiments based on the conclusions made from the current experiment. The purpose of the discussion is to provide an analysis of the results offering conclusions and suggestions for future experiments. 

Acknowledgements and Citations: This section should include all outside sources used to help explain parts of any of the sections in the article. The sources should be cited in standard APA style with numerical in-text citations. The citations should also be listed alphabetically by the last name with the lead author with each citation numbered. The in text citations include the citation number when referencing. The purpose of the acknowledgements and citations is to give credit to outside sources and authors  while also give the reader the option of looking at these outside sources to gain more information about related experiments. 

October 18

Lab #9 Results and Figures

Print Friendly, PDF & Email

10/18/18

Lab #9: Results and Figures

Purpose: In this lab students learned how to create figures in Excel for a research paper using the experimental data obtained. Each group of students also got together to create a presentation of the cell count figure and optical density. The figures were created in preparation for the results section of the research paper.

Procedure:

  1. Obtain the cell count treatment and control descriptive statistics gathered in the last lab to create a figure of the cell counts.
  2. Highlight the means for both treatment and control variables and make a stacked bar chart of the data.
  3. Add a descriptive title “Average Treatment and Control Cell Counts”
  4. Add x and y-axis labels “control and treatment” for the x-axis and  “ cells/mL” for the y-axis.
  5. Then, add a short caption describing the data shown.
  6. Add the standard error bars to the chart by highlighting the standard error from the descriptive statistics and clicking “ error bars” in the chart settings.
  7. Follow the same steps to create a chart for the optical density, except to find the correct treatment data subtract the “ppt and twine only” column data from the treatment column data to obtain the final treatment data.
  8. Use this new column of treatment and the control column to obtain descriptive statistics.
  9. Highlight the means to create a chart.
  10. Add a title ” Average Treatment and Control Optical density’s”
  11. Add the standard error bars to the chart.
  12. Next, make a figure of the directional change assay by obtaining its descriptive statistics, both for the spins and for the directional changes.
  13. Highlight the means of the directional change control and treatment and make a stacked bar chart.
  14. Change the title to “ Control and Treatment Directional Changes”
  15. Add the standard error bars to the chart by highlighting the standard error from the descriptive statistics and clicking “ error bars” in the chart settings.
  16. Next, make another bar chart of the control and treatment spins by highlighting the means of the spins from their descriptive statistics.
  17. Add the title “ Control and Treatment Spins”
  18. Add the standard error bars to the chart by highlighting the standard error from the descriptive statistics and clicking “ error bars” in the chart settings.
  19. Begin a powerpoint on google drive for the cell count and optical density figures. 

Sample Storage/ Label: none; worked in the computer lab

Data:

Conclusion: Throughout this lab I learned how to create figures in Excel based on collected data from the Tetrahymena experiment. This data will be used to further help form the results section of research paper. The bar chart figure was selected because it best represents the data and shows the differences between the control and treatment variables. The cell count figure shows the significant increase in counts for the treatment variable and the directional assay figures show the significant decrease in directional change and spins for the treatment sample. I also learned how to add error bars to the charts to represent the uncertainty of the data. My group and I created the cell count chart and I made a chart for my directional change assay. We also started putting together a powerpoint of the cell count and optical density  figures we created to present during next lab. Overall, I became familiar with creating different types of charts in excel and learned how to correctly choose a chart to best represent a data set based on which aspect of the results I want to make stand out. Next, I plan on utilizing this data and these charts to help explain the results in the results section of my research paper. I look forward to seeing everyone else’s figures and hearing about the results of the different assays performed.

October 12

Lab #8 Data Analysis

Print Friendly, PDF & Email

10/11/18

Lab #8

Purpose: In this lab students compiled class data and performed data analysis. Students became comfortable utilizing Excel functions to carry out successful data analysis with histograms and various variability tests.


Procedure:

  1. Transfer the class cell count data to a new spreadsheet by copy and pasting the control and treatment class cell counts.
  2. Transfer the behavioral assay cell counts to the new spreadsheet by typing in individually the control change in direction in one column, control spins in another and the same for the treatment directional changes and spins.
  3. In order to find the descriptive statistics for each, click tools then descriptive statistics and find the descriptive statistics of all columns.
  4. Make a histogram of each column, the cell counts and directional Assay (direction change and spins).
  5. Do this by going to data analysis, histogram and highlight one column for input and for bin range type in a range based on min and max of descriptive statistics.
  6. For output highlight the cell you want the histogram to appear in.
  7. Check the box that says  “chart”.
  8. Click “ok”.
  9. Repeat steps for the histogram for each column.
  10. Next, perform an f-test to determine which t-test to use.
  11. Go to data analysis then f-test and highlight both the control and treatment variables of the cell count in the input boxes and click on the desired output cell and then click “ok”.
  12. Repeat steps for the f-test for the behavioral assay do two f-tests; one on the control and treatment of the directional change and a seperate one for the control and treatment of the spins.
  13. If the F is bigger than the critical F then you use a unequal t-test and if the F is smaller, than the critical F then you use a equal t-test.
  14. After determining the correct T test, perform  the t-test on the cell counts and directional assay by going under data analysis and clicking the correct t test.
  15. Highlight the control column for one input and the treatment for the second input.
  16. Highlight the desired cell for the output.
  17. Click “ok”
  18. Analyze the data for trends.


Sample Storage: NONE Worked in computer lab.

Data:

  • Descriptive Statistics  

Cell count                                                       Control Directional Change                 Treatment Directional Change


  • Directional Change Assay Data:
  •   
    • Direction Change F test

Directional Change T Test

Spin F-test

Spin t-test

  • Cell Count Data
  • F-Test

T-Test

Conclusion:

Throughout this lab I learned how to conduct data analysis on experimental data. After performing multiple tests such as the f-test and t-test, finding descriptive statistics and creating histograms of the data, I was able to conclude differences between the control and treatment variables. The descriptive statistics represents the variability of the data, the f and t tests show the comparisons of the populations and the histograms represent the frequencies for a data set. The Polypropylene Micro-plastics do in fact have an effect on Tetrahymena. I was able to conclude this by looking at the p-values of the cell counts and behavioral assay. The p- value for the cell count was 0.0001 which is lower than the significance level of 0.05 which determines whether or not the null hypothesis is rejected. The p-value for the directional change was 0.005 and the p-value for the spins was 0.014 which both reject the null hypothesis. Overall I became familiar with analyzing results from data analysis as well as conducting data analysis through multiple tests and visuals. I hope to learn more about this experiment through interpreting the data in different ways and figuring out if the micro-plastics could have the same effect on other organisms besides Tetrahymena.

October 5

Bio Lab #7

Print Friendly, PDF & Email

10/4/2018

Bio Lab #7

Materials and Methods: Performing the Experiment

Purpose: The purpose of this lab was to gain experience with a serological pipette and a photospectrometer as well as perform the behavioral assays. Students performed all of the behavioral assays with the tetrahymena that had been exposed to microplastics. Students also got to learn about light absorption and find the light absorption for both the culture and treatment.

Procedure:

  1. Label 2 glass tubes control and treatment.
  2. Obtain 4 ml of the treatment and control in the correctly labeled glass tubes using a serological pipette. ( be sure to swirl the flask before obtaining samples from it with the pipette)
  3. To perform a cell count, add 2 microliters of Tetrahymena to a concavity slide and add 1 microliter of iodine.
  4. Observe under a compound microscope on magnification 40x and count the cells in the drop.
  5. Repeat the cell count for three different trials. Record data.
  6. Repeat steps 3 and 4 but using the control sample. Record data.
  7. Clean off the slide and begin the directional assay by adding a 20 microliter drop of treatment to a concavity slide.
  8. Observe on a dissecting microscope with a black plate.
  9. Using 10 second intervals, follow one cell and count each direction change and the time spent spinning (if it spins).
  10. Perform 10 trials.
  11. To find the absorption of light in both the control and treatment samples, first zero out the photospectrometer with ppt media.
  12. Then place the control sample in the photospectrometer to find the absorption of light. Record data.
  13. Next, place the twine juice without media in the photospectrometer. Record data.
  14. Then place the treatment in the photospectrometer and find its absorption. Record data.
  15. Subtract the treatment absorption from the twine juice absorption to find its total.
  16. Return samples back to racks, clean slides and put away microscopes.

Control Picture

\

Treatment Picture


Data:

Control Cell Count

Trial Dilution Control Cell count for 2 uL Control Cell count cells/mL
1 3:2 36 27000
2 3:2 32 24000
3 3:2 31 23250
Average 33 24750


Treatment Cell Count

Trial Dilution Treatment Cell count for 2 uL Treatment cell count in cells/mL
1 3:2 49 36750
2 3:2 52 39000
3 3:2 40 30000
Average 47 35250


Directional Change Assay for Treatment

Trial Direction Change- Spin
1 0-0
2 2-0
3 3-0
4 2-0
5 4-0
6 1-0
7 1-0
8 4-0
9 3-0
10 1-0
Average Direction Changes 2.1
Average Time Spinning 0

Directional Change Assay for Control Group

Trial Direction Change- Spin
1 2-0
2 4-1
3 3-0
4 3-0
5 5-2
6 2-0
7 7-0
8 2-0
9 5-1
10 1-0
Average Direction changes 4.3
Average Time Spinning .4 seconds

Light Absorption

Samples Light Absorption
PPT Media .0 abs
Control .010 abs
Treatment without Cells .075 abs
Treatment with Cells .089 abs


Storage:

The slides were cleaned and set to dry. The control and treatment samples will be kept in glass tubes and flasks for further experimenting. The control sample glass tube was labeled “c” and the treatment sample glass tube was labeled “t”.

Conclusion:

Throughout this lab I performed the experiment testing the behavioral effects of brown baling twine polypropylene microplastics on Tetrahymena by testing the cell count and behavioral assays. Within this experiment I gained experience with the serological pipette when transferring the samples from a flask to glass tubes. I also found the light absorption in both the treatment and control samples using a photospectrometer. I performed the directional behavioral assay with Annie and my two other lab partners Hayden and Kelsi performed the speed assay and the vacuole formation assay. After comparing the average directional changes my group concluded that the cells became a little less active with exposure to the “twine juice”.  From this experiment I also found that with exposure to microplastic, “twine juice”, the Tetrahymena reproduced at a greater rate. My final average of the control variable was 24750 cells/ mL compared to 35250 cells/mL in the treatment group. Overall the experiment was very successful in finding out that microplastics do have an overall effect on Tetrahymena. Some next steps would be to compare my data with my classmates and obtain an average to be able to come up with a final result and to note the overall effect of the microplastics. I hope to continue research on this experiment and find out if these results can be applied to other organisms.

September 27

Bio Lab #6

Print Friendly, PDF & Email

9/27/18

Bio Lab #6: Experimental Design and Preparation

Rationale: The purpose of this lab was to experiment with dilutions and learn how to calculate concentrations of substances. Also in this lab the student prepared the polypropylene twine that will be used as the microplastic for a future experiment. The student also learned the importance of analyzing different types of assays and how they can contribute to the results of an experiment.

Procedure:

  1. Obtain polypropylene twine and cut to small pieces
  2. Weigh out 0.5 grams of chopped twine
  3. Add the twine to a small glass and add 50 mL of Proteose-Peptone media to the twine in the glass
  4. Microwave the glass with twine juice for 32 minutes.
  5. Next, add 5 microliters of iodine to a petri-dish and then add 20 microliters of Tetrahymena sample to the iodine.
  6. Mix the substance with the up and down motion of the micropipette.
  7. Obtain a concavity slide and 3 seperate drops of 5 microliters of the iodine and tetrahymena substance onto the same concavity slide. (make sure the 3 sets of 5 microliters are separate on the slide)
  8. Observe the slide under a compound microscope on the 4x magnification and see if the counts of each sample are under 50 cells
  9. If there are too many cells to count, perform a 1:10 dilution by adding 45 microliters of media to the total substance and mix with the micropipette.
  10. Re-distribute the substance into 3 seperate, 5 microliter drops on the concavity slide and observe the cell count under the compound microscope. (there should be a decrease in cells in each drop)
  11. Record the cell count for each drop, then calculate the average.
  12. Clean the slide and petri-dish.
  13. To perform a behavioral assay of Tetrahymena analysing their directional change, obtain a slide and 5 microliters of Tetrahymena sample.
  14. Place onto a dissecting microscope using a black reflecting plate underneath the slide.
  15. Time 10 second trials and within each ten seconds focus on one tetrahymena cell and count each time they change direction within the time limit.
  16. Perform 6 trials and record the average.


Data:

Trials Cell Count
Trial 1 48
Trial 2 58
Trial 3 62
Average 56

Behavioral Assay: Directional Changes

Cell Number of Changes of Direction
1 5
2 4
3 6
4 10
5 3
6 5
Average 5.5


Standard Deviation= 0

Storage: The Twine Juice is stored in a glass to be used for further experimenting and the slides used for dilutions and the assays were cleaned and set to dry.

Conclusion/Future Steps: In this lab, we started the process of storing and preparing the polypropylene that we will use in a future experiment. Also in this lab I successfully diluted a Tetrahymena sample in order to see them more closely and get their concentration to where the cells were easier to count. In addition, I was able to observe the directional changes of Tetrahymena and my lab partners Kelsi and Hayden completed the other two behavioral assays of Tetrahymena speed and the vacuole formation. Overall, we got to learn more beneficial lab techniques and also learn more about the characteristics and specific behavior of Tetrahymena; specifically learning how observing these behavioral assays of organisms can be very crucial when analyzing the effects of a treatment. As for the next steps of the twine solution, it will be left in a 55 degree celsius water bath overnight and then the next day the mixture will be filtered and autoclaved. This will help prepare the plastics for future testing of their effects on Tetrahymena. In the future I hope to use all the techniques we have learned and I look forward to using these behavioral assays in a future experiment after a treatment has been done to the Tetrahymena and analyzing how the treatment effects them.

September 20

Lab #5

Print Friendly, PDF & Email


Lab #5: Serial Dilution and Experimental Design

9/20/18

Purpose: The purpose of this lab was to learn about the process of serial dilution, learning more in depth about experimental design and correctly storing soil samples. Students gained experience with the 1000 microliter pipette during the process of serial dilution. Serial dilution makes counting cells in a sample easier with less to count. Throughout this lab, the students formed new lab groups and became more comfortable with creating an experiment and planning out the methods and different aspects of the future experiment such as timing, variables and materials. Before lab, students were asked to collect a soil sample from a specific location which will be used for a future experiment. In this lab, students correctly labeled the soil samples and put them into petri dishes to store for a later experiment.

Procedure:

  1. Begin the process of storing your soil sample by obtaining a petri-dish and label your name and soil identification onto the top and bottom of the petri-dish.
  2. Record the mass of the bottom of the petri-dish.
  3. Add a small sample of the soil into the petri-dish and weight both the bottom of container and soil.
  4. Place the soil and petri-dish in designated location
  5. Start the process of serial dilution by first obtaining a 1000 microliter micropipette and practice transferring water to a petri-dish with this larger micropipette.
  6. Then, locate the stock culture in the well plate and view it on the dissecting microscope and note any observations.
  7. Add 900 microliters of culture media with a micropipette to 4 empty wells on the well plate
  8. Add 1000 microliters of stock culture with a 1000 microliter micropipette to the first well and mix briefly by moving the solution up and down with the micropipette.
  9. Eject the tip of micropipette and take 100 microliters of the first well and place into second well, mix briefly.
  10. Then eject tip and add 1000 microliters of the second well and add it to the third well, mix briefly.
  11. Eject tip and take 1000 microliters from the third well and add it into the fourth well and mix briefly.
  12. View the diluted samples under a dissecting microscope and choose the optimal samples to observe and note which ones have less cells to count.
  13. Observe each dilution and count the number of cells in each on a concavity slide on the compound microscope. Record data
  14. Record the cell count in 5 microliters then find the number of cells per microliter, the number of cells in an undiluted sample and lastly the number of cells in milliliters in an undiluted sample.
  15. Clean slides, put away microscopes, pipettes, and micropipette tips.
  16. Next, go to the computer lab and create class spreadsheet with each student’s serial dilution average.
  17. Get with lab group and talk about a possible experiment to do with Tetrahymena and microplastics.
  18. Come up with a question and falsifiable hypothesis
  19. Then describe the methods and treatment for the experiment utilizing the given examples of article methods.
  20. Lastly, plan out how you would conduct the experiment using a 24 well plate and what each well would hold also including how you would measure the effect of the treatment.

Data:Serial Dilution

Trial Dilution: Cell count in 5 microliters Cells Per Microliters in the drop Cells / Microliter in the undiluted sample Cells/Milliliter in the undiluted sample
1 10^-2 35 7 700 700,000
2 10^-3 3 .6 600 600,000
3 10^-4 1 .2 200 200,000
Average 500,000

 Data: Soil Sample

Bottom of Petri-Dish Mass 5.8g
Petri-Dish + Soil Sample Mass 27.6g

Sketch:

Where Final Sample is Stored:

The sample of my soil is stored in a petri-dish labeled mo34fall18

The remaining soil sample is stored in a plastic bag

Conclusion: Throughout this lab I learned the process of serial dilution and how it can make it easier to count the amount of cells on a microscope. I was able to observe the decrease in amount of cells in the tetrahymena sample as each dilution factor increased. By going to the computer lab and researching a new experiment to do in the future I gained insight into how to form a falsifiable hypothesis and create methods and treatment for my own possible experiment. My group came up with an experiment that will measure the population change after being exposed to microplastics. As we were brainstorming the methods for this experiment I learned that in order to keep the concentrations the same between the two variables being used, you must add culture media to equal the addition of amount of microplastics being added to one variable. Overall, I hope to keep learning new lab techniques that I will be able to utilize for my group’s future experiment. I also plan on furthering my research about microplastics and scientific articles overall to become comfortable enough to write my own scientific article.


September 13

Bio Lab #4

Print Friendly, PDF & Email

9/13/18 Bio Lab #4 : Tetrahymena and Micropipettes


Objective: The purpose of this lab was to learn how to properly use micropipettors while also becoming familiar with the model organism Tetrahymena. Through the use of micropipettors, the student was able to transfer small amounts of tetrahymena samples and examine them more closely.


Procedure:

  1. Transfer 100 Microliters, using a micropipette, into a well plate.
  2. Place it onto the dissecting microscope and locate and examine Tetrahymena to make sure the sample contains a good amount of moving Tetrahymena.  You can use the black contrast plate in order to see the reflection and examine the sample better)
  3. Then put the dissecting microscope away and obtain a compound microscope.
  4. Use a micropipette to obtain a 5 microliter sample and then release it onto a concavity slide.
  5. Dispose of the micropipette tip and return micropipette into original location.
  6. Analyze the characteristics of the sample on the compound microscope using the concavity slide without a cover slide for the 4x and 10x magnifications. Use a cover slide for magnification 40x.
  7. At each magnification record the number of cells seen, the approximate diameter of the cell and then finally sketch what you see at each magnification.
  8. Put away the compound microscope and clean out well plates and slides.
  9. Next, research primary articles that explore micro plastics and Tetrahymena.
  10. Then, collaborate with lab group and use experimental design to come up with a possible experiment that use the variables micro plastics and the model organism, Tetrahymena.


Data:

Trials Number of Cells Approximate Cell Diameter
1 75 20 μm
2 25 50μm
3 20 70μm


Sketch:

Storage of Sampling and Labeling: NONE; cleaned slides and set to dry.

Conclusion: In this lab I learned how to correctly use a micropipette by practicing transferring Tetrahymena samples onto slides and examining them on a compound microscope. I also learned the importance of experimental design and how it is used to build a successful experiment. My lab group successfully created a possible experiment to do in the future with micro plastics and Tetrahymena through the use of experimental design. Throughout the Tetrahymena experiment I was able to gain insight into the characteristics of Tetrahymena and how they are good model organisms which we will eventually be using in future experiments. Some errors that could have occurred throughout the lab include misusing the micropipettes by either releasing the plunger to quickly when obtaining the substance resulting in air bubbles or pushing down the plunger to quickly passed the first stop. Overall this was a successful experiment and I hope to learn more about how Tetrahymena can be used to measure different variables as model organisms.