November 16

Lab 13

Print Friendly, PDF & Email

Objective:

The purpose of this lab was to determine the texture of the soil samples that we collected and to find and classify the ciliates we found within them. We then discussed in our groups about a plan for our presentation and how we will execute this plan.

Procedure:

  1. Obtain the falcon tube containing your soil.
  2. Observe the layers of sand, silt, and clay.
  3. Use a ruler to measure each layer in the tube in centimeters.
  4. Take a picture of the ruler and falcon tube for later reference.
  5. Find the percent mass of each layer by taking the measurement of each layer divided by the total of all three layers and multiplying by 100.
  6. An example of how to do these calculations was provided for us on the board.
  7. Use the percentages to follow the chart for finding the textures of the soil sample.
  8. Get your non-flooded plate from hope.
  9. Place multiple 20 µl drop of water from the non-flooded plate onto a clean concavity slide.
  10. Observe these drops under a compound microscope and record any ciliate findings in your journal and take a picture.
  11. Observe the ciliates movement and if to hard to do so you can dye the drop iodine so that they stop moving and you get a better picture.
  12. Observe the ciliates and attempt to classify them.
  13. Record these findings in lab notebook.

Data and Observations:


Ciliate Observation:

I found many ciliates in my sample, some were moving fast and were hard to see while others were slower and more observable. To see the faster ones I dyed my drop with iodine.


Storage:

The slides I used were cleaned and set out to dry. The microscope was covered and placed back in place. The non-flooded plates were placed in the hood. My falcon tube containing soil was placed in the rack.

Conclusion and Future Steps:

The soil texture test was intriguing because I discovered the soil I had allowed more ciliates to grow and prosper compared to some of the other soil samples. It was also cool looking for ciliates within our non-flooded plates because there were many types of ciliates that were able to be observed and seen thriving in their natural environment. I was not able to identify the ciliates I found but have decided to do my best by taking screenshots within the videos and comparing the ciliate images to those of the ones on the internet. This information will be presented to the class later in the lab and we will all be able to share our findings and further our knowledge on the ciliates.

November 2

Lab 11

Print Friendly, PDF & Email

Purpose-

In this lab we learned about how to calculate pH of a sample as well as how to properly observe a live specimen within its environment,  which were the soil ciliates. We found the pH of the soil sample as well as the water content percent of the sample as well.

Materials-

  • Soil Samples
  • Micro-pipettors
  • Compound Light Microscope
  • Dissecting Microscope
  • Cover Slides
  • Concavity Slides
  • Petri Dish
  • PH Paper

Procedure-

  1. Obtain  Soil Sample
  2. Record the masses needed in the Lab QTM
  3. Use the masses to calculate water content percent.
  4. Use the water content formula to make calculations.
  5. Saturate the dry soil in the petri-dish with distilled water creating a non-flooded plate. Which was done 30 hours before lab by Michael.
  6. To find the pH of the sample, transfer 1000 microliters into a centrifuge tube and place it in the centrifuge for one minute, make sure if there are multiple samples in the centrifuge that they are across each other for balance.
  7. Let the soil settle and then take 20 microliters and transfer it to the lid of the petri-dish.
  8. Take a small strip of pH paper and submerge it into the drop of soil sample, then take another strip and place it in the sample fully submerging it.  Wait one minute before comparing the colors of the pH paper.
  9. Record PH
  10. Observe the sample under a dissecting microscope in the petri-dish and record observations.
  11. Take 10 microliters of sample and place it on a concavity slide. Observe under a compound microscope for ciliates. Take pictures and record observations.
  12. Clean slides and put away microscopes.

Water Content/PH-

  • Formula: Wet soil – dry soil/ wet soil X 100
  • Water content- 23%
  • PH: 7

Storage-

Soil samples were stored in petri-dishes and the dissecting microscopes were pushed back into their original spots. The rest of used materials were cleaned up and disposed off and or washed off and cleaned.

Conclusion-

Throughout the lab I found the water content and pH of the dried soil sample.  My sample had a lot of mulch and dirt and not much empty space in the petri dish so I had to make a spot in the middle to view the ciliates. The ciliates appeared small and round moving very quickly, I also saw some round worms and nematodes.. Overall, I was successfully able to observe ciliates within my soil sample and learn how to find water content and pH level. In the future I hope to be able to further analyze soil ciliates and learn more about their function and characteristics.


October 26

Lab Notebook 10

Print Friendly, PDF & Email


Andrew Patterson

Lab 10 Notebook

Abstract:


The abstract is a summary of the lab report and all that we did into a short paragraph which makes it easier to gain quick information. It highlights the most important topics the report contains. Include why we did what we did and the results and conclusions that were found. This section allows other scientists to gain knowledge of the report before reading so that they can tell if it is useful for them or not.


Introduction:


The introduction should include the purpose of why it was done and relevant background information regarding the organisms and or the lab being tested. The background information will tell readers why this experiment is important in science. The hypothesis and reasoning behind will also be included.


Materials and Methods:


The materials and methods section of the paper should include details of how the experiment was performed. It should be detailed enough for someone to be able to repeat the experiment. The reasoning behind some steps and how to perform calculations should also be included so that again, the experiment can be repeated.


Results:


The results section should include graphs with descriptions of the graphs that explain what the data is showing. All other figures and tables should be included within this section. Use captions to explain what the tables and graphs represent.


Discussion and Conclusion:


This section brings up the data and uses the charts and graphs to explain trends that are shown. You will determine whether the hypothesis was accepted or rejected according to data. Provide explanations for any unexpected results and restate your findings in the experiment such as objective and results.


References:


The references section contain the sources of information and where it came from in order to give credit for their work. Make sure to include all necessary data for citing someone as well as the link to the source.

October 12

Lab 8: Excel

Print Friendly, PDF & Email

Objective and Purpose:

The purpose of this lab was to get exposure to working with Excel. This allowed us to view the statistical data that backs our observations and also allows us to see how the different in ways we could analyze the data that we may have not otherwise known.   The overall purpose of this lab was to receive exposure to the statistical analysis side of scientific research.

Procedure:

  1. Locate the data sheet on canvas and edit the information that may have been entered incorrectly or repetitive data sets between you and your partner.
  2. Listen to the presentation about statistical analysis from Michael.
  3. Download class excel sheet from canvas and go to cell count sheet.
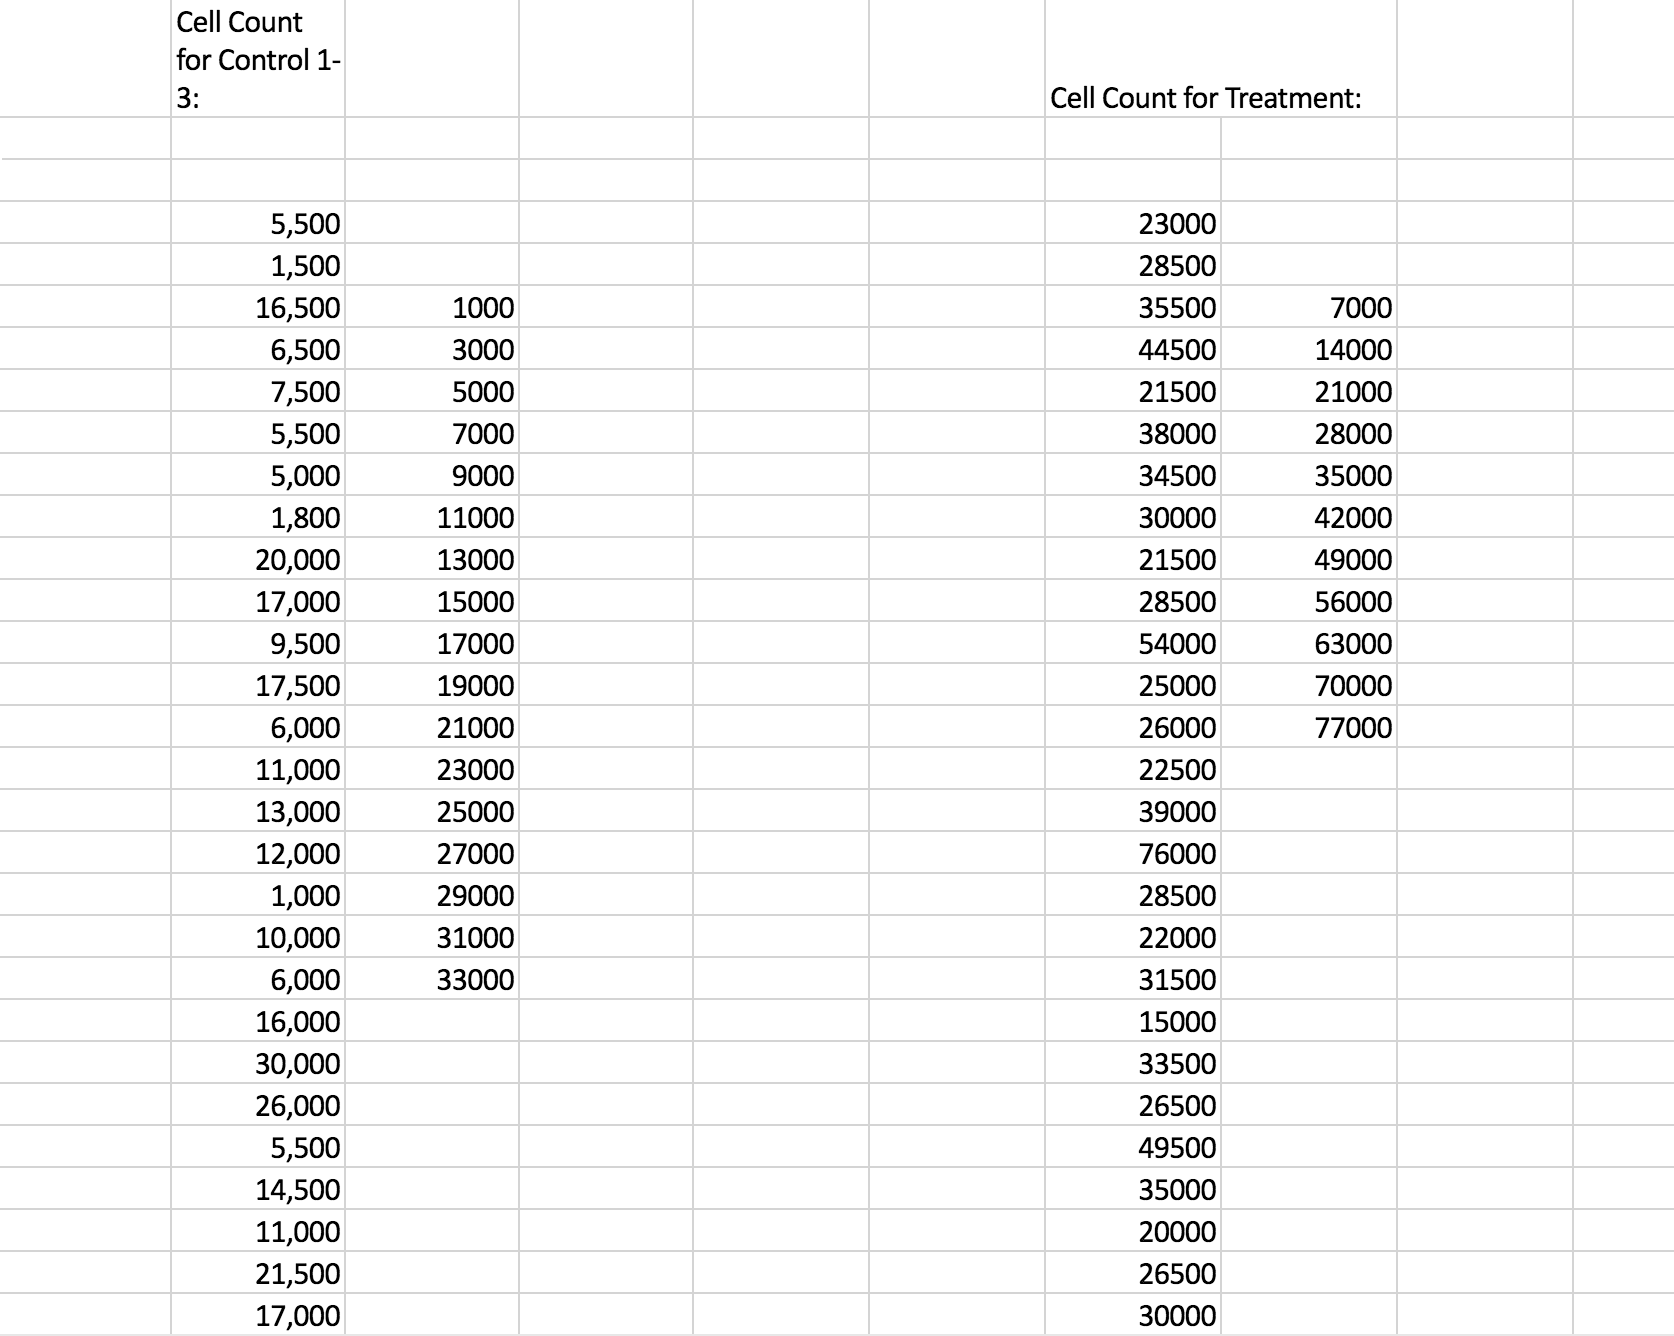
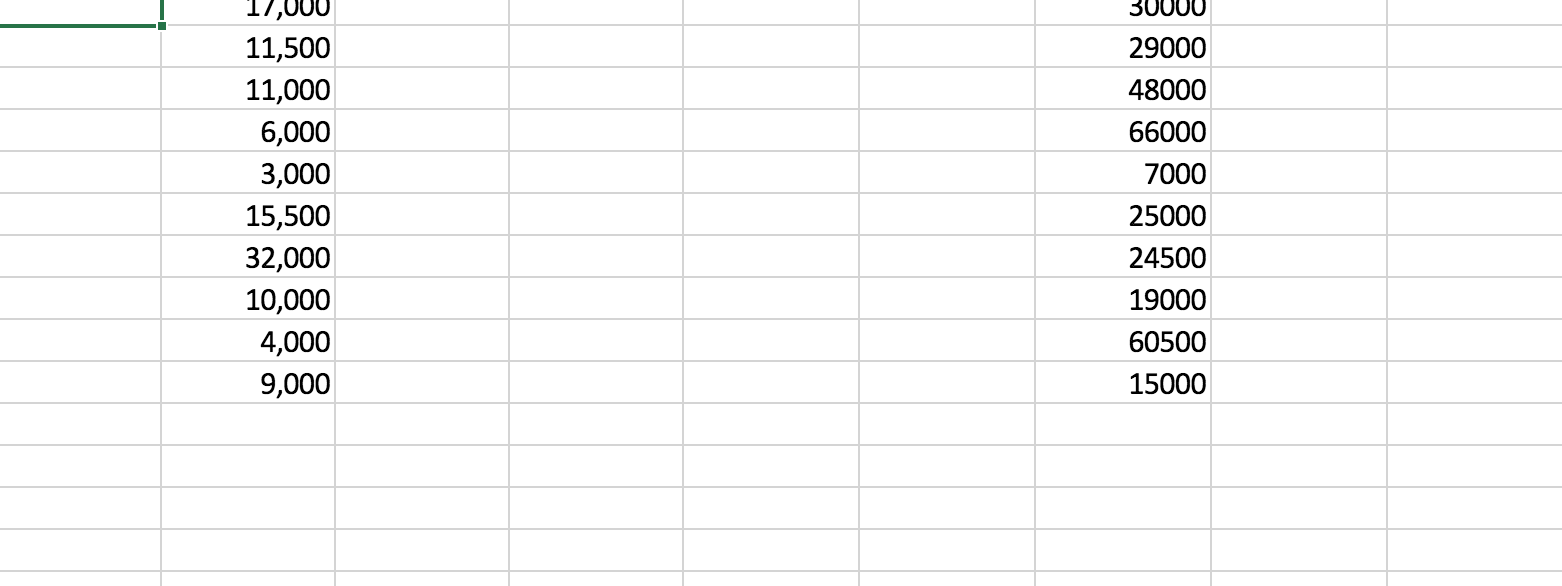
  4. Enter the control data column into a single column on the sheet then, using the data analysis toolkit, do a data analysis.
  5. Repeat for treatment group.
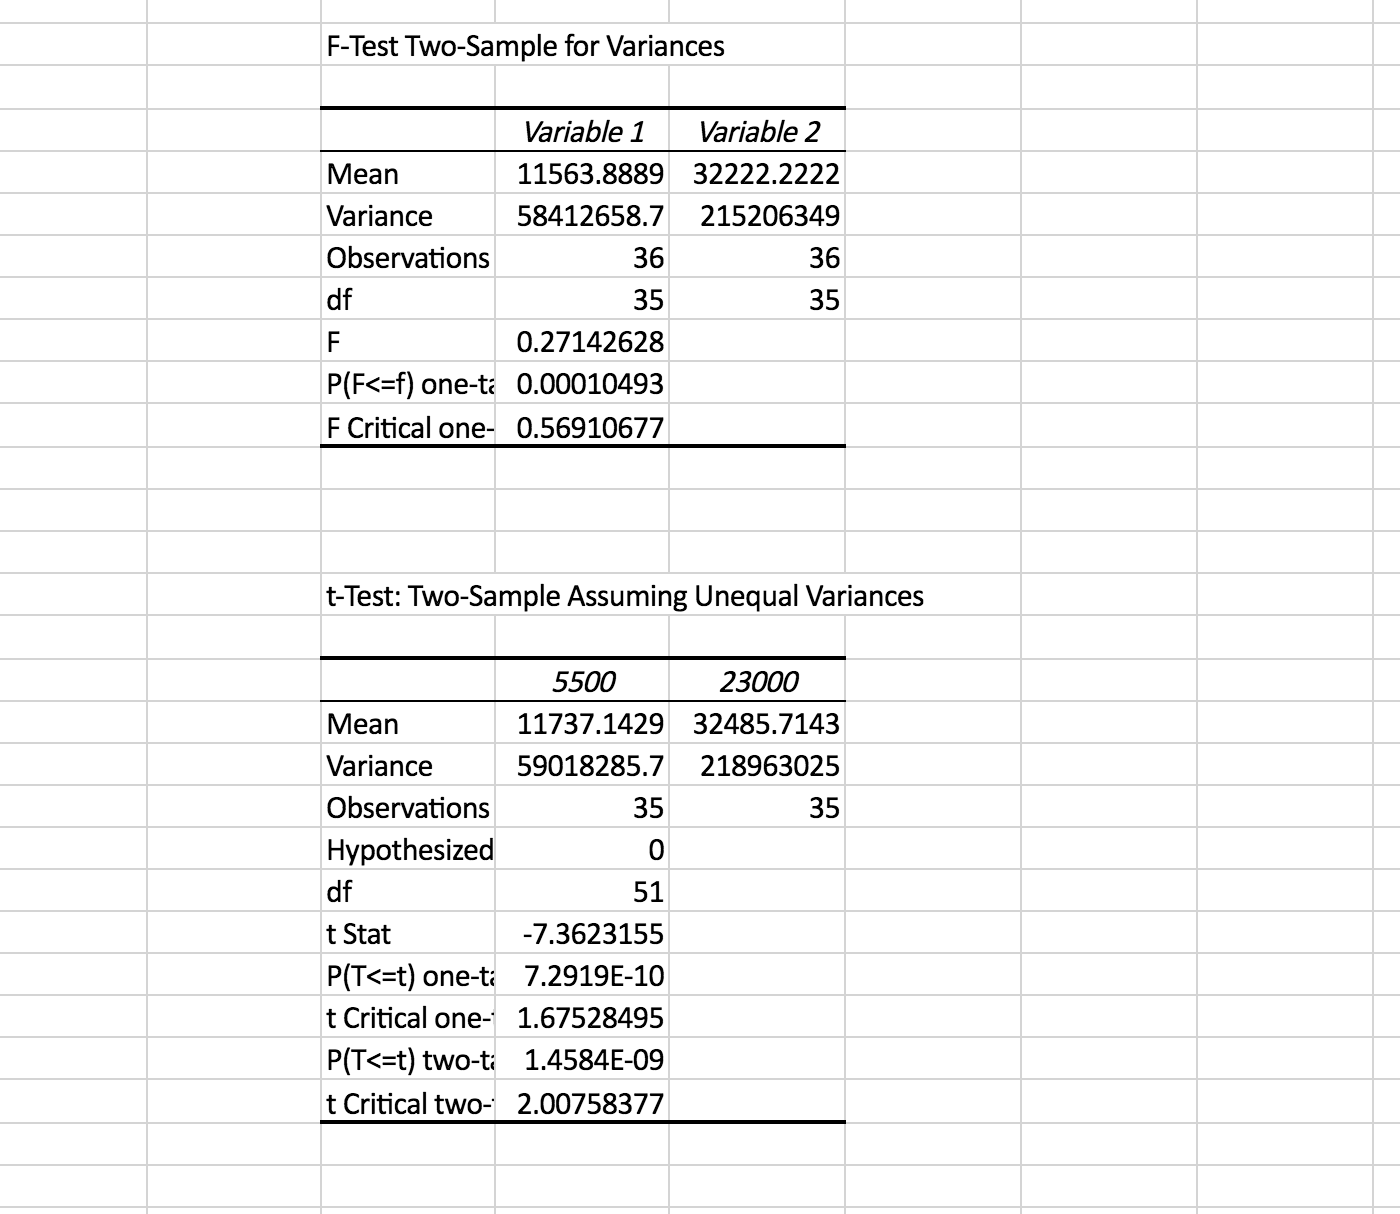
  6. Then do a F-Test 2 sample for variances using the data analysis toolkit, using the control column for one variable and the treatment for the other.
  7. Next do a t-test with unequal variances for control and treatment. The data from this table that will be used is the calculated t-stat and p-values.
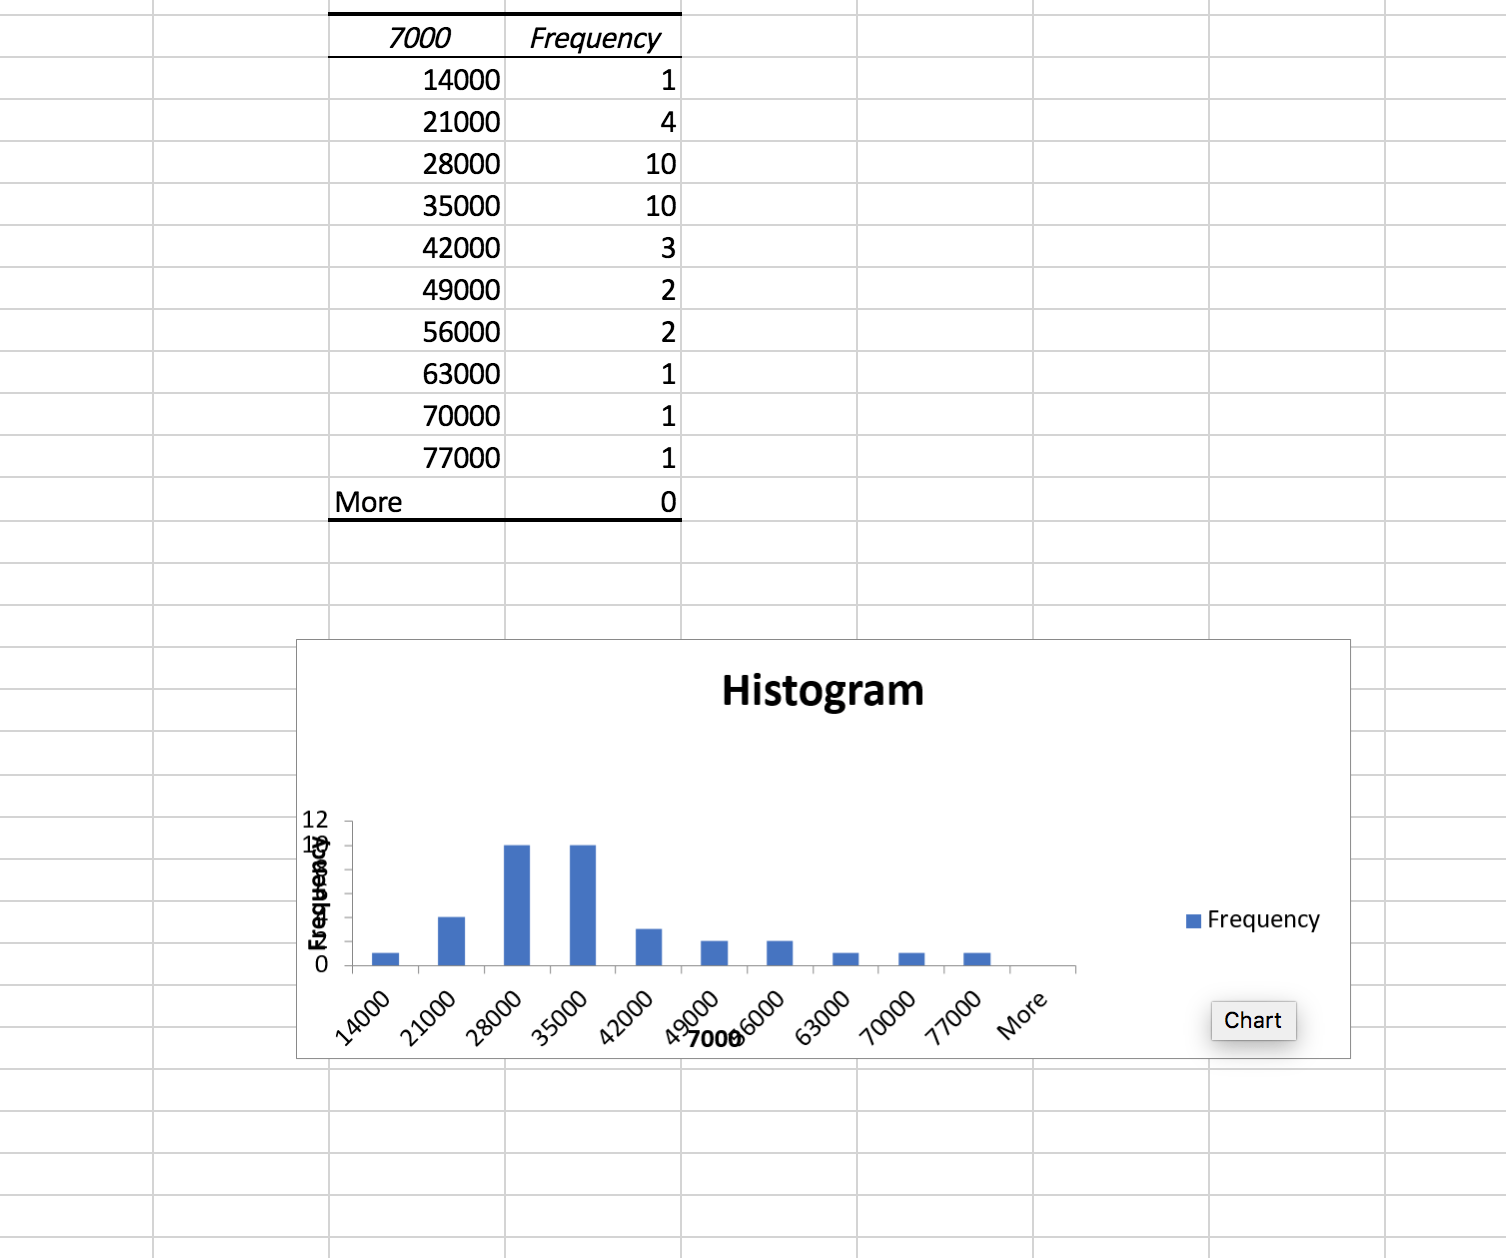
  8. Then assign bin numbers based off your cell count numbers to use for a histogram with your data. Then using the data analysis toolkit, use the histogram tool to create a histogram for the control and treatment data.
  9. Repeat for treatment group.
  10. Go to your designated assay sheet and create two columns for control and treatment with all the data.
  11. Using the data analysis toolkit preform a t-test, f-test, and histogram test as done in the cell count.
  12. Save the excel sheet and submit to canvas Lab 8 QTM.
Data:
Class Cell Count Data:
Swim Speed Assay Data:

Storage:

Properly save the Excel sheet and the Word document and turn into the Lab 8 QTM. Power off computer.

Conclusion & Next Steps:

This lab allowed us to view the statistical properties involved with the data we collected last week.  The data provided from the Excel calculations allowed us to see the mathematical portions of our data through p-value, null hypothesis’, and to see the how the control and treatment groups compared through variances and histograms. We also got to learn more about Excel and better our skills with it.

Overall, we saw on the cell count sheet that more Tetrahymena were present on average in the treatment group,  than the control group. This is interesting because we assumed that it would instead have a negative effect on the tetrahymena. Additionally, the results from the t-test show the p-value is very small, therefore providing evidence that the addition of PPT with the Tetrahymena positively affects the cell count rather than negatively. The calculated f-test allowed us to determine if the variances were equal or unequal which then allowed us to determine which t-test to use and then allowed us to determine whether we should reject the null hypothesis.  The same principle was copied in our assay calculations. There were many errors  with the class data that were included by instruction from the Dr. Adair, Michael, and Hope; therefore, no absolute conclusions can be made based off this data.  Also, within the lab so it was difficult to finish on time and I ended up finishing on my own outside of the lab.  Going forward, this data will allow us to compare the effects of PPT on Tetrahymena in more ways than we could have seen in the typical lab setting through cell counts and behavioral assays and allow us to use Excel to give us more quantitative data so change our hypothesis.

October 7

Lab #7 Experimental Day of Polypropylene and Tetrahymena

Print Friendly, PDF & Email

Purpose:

The purpose of this lab was to further practice our lab skills which include micropipetting, cell counts, using microscopes, taking samples, timing organisms, and begin the experiment. To observe the effects of the polypropylene on Tetrahymena’s behavior of the Tetrahymena from the control and treatment group in the swim speed assay.

Procedure:

  1. Before beginning the lab, be sure your workstation is clean to avoid any hazards.
  2. Then get 5 mL of the control solution and 5 mL of the treatment solution using a pipette gun.

Cell Counts:

  1. Take your control and place three drops of 2 μl of Tetrahymena onto a flat slide.
  2. Add 1 μl of iodine to each drop.
  3. Place on the stage of a compound light microscope and begin counting the cells in each drop and record data. Be sure to work quickly because the droplets evaporate quickly.
  4. Repeat steps 1 through 3 with the treatment test tube.
  5. Calculate the number of cells.

Optical Wavelength:

  1. Place the PPT test tube into the Spectrophotometer and calibrate to zero. Record value.
  2. Take out the PPT test tube and replace with the treatment test tube into Spectrophotometer and record value.
  3. Take out the treatment test tube and replace with the control test tube into Spectrophotometer and record value.

Swim Speed Assay:

  1. Measure out 20μl of control solution and place onto a flat slide.
  2. Turn on dissecting microscope and place the slide with a ruler under onto the stage.
  3. Set up a timer and watch the Tetrahymena swim between the two marks on the ruler.
  4. Choose one Tetrahymena and start the timer when ciliate crosses first line. Stop the timer when it crosses the second line and record data.
  5. Repeat step 4 nine more times.
  6. Repeat Steps 1 through 5 with the treatment solution.

Data: 

Cell Count-

Treatment Control
43 17
57 26
96 10
Speed Assay- Treatment and Control
1 1.91 3.50
2 1.51 4.25
3 2.36 3.73
4 1.86 4.88
5 2.61 2.60
6 3.16 3.81
7 2.18 2.78
8 1.98 3.90
9 2.16 4.38
10 1.79 4.06
 Spectrophotometer Data-
Solution Observed Amount of Light Absorbed
PPT Media 0
Control Group .025
Treatment Group .077
Twine Juice .058
Difference .019

Storage: 

All of the slides that were used were rinsed off and put on the paper towels to dry. The micropipettor tips were disposed of and the micropipettors themselves were put back on their racks. The microscopes were put back in their place and covered properly.

Future Steps:

After performing this lab students are more familiar with tetrahymena and are able to perform their actual experiments in the future. Students are also going to be able to perform more complicated procedures using the lab techniques they have been practicing in the past labs. Students will use the learned behaviors of tetrahymena to observe them in their future experiments in the lab.

Conclusion: 

To conclude we learned how to take smaller samples and observe the tetrahymena under the microscope. We all improved our collaborative skills with one another and our critical thinking skills.

September 28

Lab 6: Ciliate Count Challenge and Assays

Print Friendly, PDF & Email

Objective-

The objective of this lab was to increase our lab experience with microplastics, to practice cell counting, to get better at serial dilutions, and to look at the behavior of Tetrahymena.  In doing so, this lab allowed us to receive more practice with Tetrahymena, better our skills with micropipettes, better our skills in slide preparation,  as well as measuring techniques, and dilutions. This lab also helped to better our communication and social skills with our new lab partners.

Procedure-

  1. Take the bailing wire, polypropylene, for you section, a foil tray, scissors, and a scale. Tare the scale with the foil tray on it then cut small pieces of the bailing wire into the tray until you have a .5g sample.  Place the .5g sample into a sterile glass container.
  2. Measure 50mL of PPT and pour it into a sterile glass container with the bailing wire.
  3. Place container in microwave and place the proper cover on it.
  4. Next take a Tetrahymena sample and get a 20 µm sample and eject it onto the petri dish. Repeat two more time.
  5. Take the iodine solution and get a 5 µm sample and place it in/on top of the Tetrahymena sample. Repeat with the other Tetrahymena samples on the petri dish.
  6. Take a 5µm sample of prepared sample and place 3 drops on a concavity slide.
  7. Using a compound microscope, look at each drop at both x4 and x10 objective then count the cells and record in data table.
  8. Clean and put away material
  9. For my assay I got out the dissecting microscope.
  10. Then you place a 20µm drop of Tetrahymena sample onto a slide.
  11. Place slide on top a clear ruler so that you cant see cells between the millimeter marks.
  12. Time a cell of your choice as it crosses from one ruler mark to the other.
  13. Repeat and time 10 times.
  14. Take the average and standard deviation of your results.
  15. The other two assay procedure were done by my lab partners: Annie Dugan and Adriana Robledo.

Data-

Ciliate Count Challenge:

Left Drop (diluted) Middle Drop (diluted) Right Drop (diluted)
18 32 24

Average: 24.66

Left Drop (not diluted)
Middle Drop (not diluted)
Right Drop (not diluted

Simple Swim Assay:

Cell 1 2.45 s
Cell 2 4.32 s
Cell 3 3.78 s
Cell 4 4.94 s
Cell 5 2.03 s
Cell 6 3.95 s
Cell 7 2.76 s
Cell 8 2.75 s
Cell 9 4.61 s
Cell 10 3.06 s

Average: 3.465

Standard Deviation: .989604


Direction Change Assay: Completed by Annie Dugan

Vacuole Formation Assay: Completed by Adriana Robledo


Storage:

In the Ciliate Count Challenge I first took off the used tips to my micropipettors and disposed of them. I then hung  the micropipettors on the rack. Next I took the the slide with the three drops of tetrahymena to the wash station and properly washed and cleaned it, I then set it on the paper towels to dry. Next I turned off my lab microscope and put it back in its original spot where I then covered it back up. The twine juice was left with Hope, our LA, and the PPT and PP was placed in desired area. The rest of the work area was cleared and cleaned as necessary.

For the Simple Swim Assay I first cleaned off my slide and put it on the drying towels. Then I turned off my microscope and placed it back in its original spot with its cover on. The micropipettor being used had the used tip disposed of and the micropipettor was placed back on its rack. I then wiped off the work station and cleaned my lab notebook.


Conclusion:

When using Tetrahymena it was easy to be able to calculate their speed, directional changes, and vacuole formation. This lab allowed us to continue to practice the lab methods we have been using: these include slide preparation, locating samples on a slide, using a microscope, and micro pipetting.  This lab also aloud us to collaborate more with our lab partners.  Due to lack of  time I was unable to complete my assay during the lab, so I had to come back during open lab along with Annie, but Adriana finished during the lab and had her results immediately. In my Simple Swim Assay to calculate the average and standard deviation I used a calculator and program. To calculate times I used my phone and would click the start and stop.  Overall, this lab was another step into our ciliate research and collaboration in small groups but as well as a large research classroom. Bettering our knowledge and skills along the way.


September 21

Lab 5: Serial Dilutions

Print Friendly, PDF & Email

Objectives/Goals: The objectives of this lab is to learn how to do serial dilutions, observe the amount of tetrahymena in each dilution, improve our skills in micropipetting, and storing our collected soil samples.

Materials: 

  • Petri dish
  • p-1000 micropipettor
  • well plate
  • concavity slide
  • stock solution
  • compound microscope
  • dissecting microscope
  • collected soil

Procedure:

Collecting Soil-

  1. Collect soil from tree
  2. Weigh bottom of the petri dish with and without soil
  3. Transfer soil from bag to Petri dish
  4. Label top and bottom of Petri dish with name and soil identify
  5. Record soil weight
  6. Cover Petri dish and place in fume hood

10-fold Serial Dilution-

  1. Observe tetrahymena in the stock well plate using a dissecting microscope
  2. Choose a vertical column in the 24 well plate
  3. Label 4 wells of the 24-well plate: 10^-1, 10^-2, 10^-3, 10^-4.
  4. Add 900 μl of the tetrahymena culture media to the 4 wells
  5. Add 100 μl of 10^0 (undiluted) stock culture to the -1 well, mix by pipetting up and down, change tips with each dilution.
  6. Add 100 μl of 10^-1 sample to -2 well, mix
  7. Add 100 μl of 10^-2 sample to -3 well, mix
  8. Add 100 μl of 10^-3 sample to -4 well, mix
  9. Observe each well under the dissecting microscope and count the number of ciliates you see.
  10. Choose a well and transfer three 5 μl drops to a concavity slide
  11. Observe the 3 drops under the compound microscope and count the ciliates from each drop, record the number of tetrahymena you see.
  12. Determine the average count between all 3 drops and record in data table.

Computer Lab-

  1. Come up with various questions regarding ciliates and microplastics
  2. Hypothesize
  3. Methods of treatment
  4. Research how to do an experiment based on your hypothesis.

Data:

Mass of dish 5.8 g
Mass of dish with soil 18.9 g
Mass of soil 13.1


Trial Dilution: Which Dilution did you use to make your counts? Cell count in 5µl Cells per µl in the drop (x/5) Cells/µl in the undiluted sample (x dilution factor) Cells/ml in the undiluted sample (x 1000 µl/ml)
1 10^-2 11 2.2 220 220000
2 10^-3 6 1.2 1200 1200000
3 10^-4 0 0 0 0
Average 710000


Observations:

 The more we diluted the wells the less tetrahymena were observed. 10^-2 dilution was the most countable well plate.

Storage: 

The Petri dishes with soil inside were put under the fume hoods to dry out and allow the ciliates to become cysts. The concavity slides were rinsed with the cleaning solution and water and were placed on paper towels to dry. The microscopes were covered. The used micropipettor tips were discarded, and the micropipettors were hung on their racks. The stock solution, Tetrahymena media, and well plates were left on the tables for the instructors to handle.

Conclusion/Goals: 

In this lab I was able to further my skills in micropipetting and using lab tools. My goal was to learn how to properly execute a 10-fold serial dilution which I was able to complete. I also was able to gain a deeper understanding of where ciliates are found due to me getting my dirt. The computer lab enabled us to think outside the box on how the waste we put into the environment has an effect on the organisms around it.

September 14

Lab 4: Meet Tetrahymena Activity

Print Friendly, PDF & Email

Objective: The goals of the lab were to meet Tetrahymena through the use of new microscopes, practice our knowledge on microscopy, learn how to use a micropipettor, and dive into literary research on microplastics.

Purpose: The purpose of this lab was to observe Tetrahymena, count the number of them in a given area, and record its characteristics. We also furthered our knowledge and skills in the use of microscopes as well as gain a new skill in micropipetting. We also furthered our knowledge in the use of concave microscope slide. After the initial lab we were able to begin some research on microplastics and the mass effects they are having and will have on our soils, oceans, and organisms surrounding them.

Procedure: 

  1. Transfer 100µL of Tetrahymena stock culture to a clean well using the correct micropipettor.
  2. Observe the Tetrahymena in the 24-well plate using the dissecting microscope.
  3. While looking through the dissecting scope, pick 5µL of cells from the well using a P-10 micropipettor.
  4. Transfer the 5µL to a concavity slide and observe on 4x and 10x using the compound scope.
  5. Record the amount of cells you count per 5µL.
  6. Using your FOV measurements, approximate the diameter of Tetrahymena.
  7. Record your procedure and obervations in your lab notebook. You may use a table.

Table: 

Trials Number of cells in 5µL Approximate diameter of the cell
1 70 (roughly) 17μm
2 120 (roughly) 17μm
3 45 (roughly) 17μm

Conclusion:

In this lab we used microscopes to observe and become familiar with tetrahymena. We learned a new skill of micropipetting and also used concave slides to observe smaller concentrations of the tertrahymena. Working with the new compound microscope made it significantly easier to see the tetrahymena against the white light due to the use of the black plate and the clarity of the microscope. When counting the tetrahymena the amount I selected varied due to unequal distribution of the cells and i also extracted them at an angle which may have been incorrect form. When researching for our articles about microplastics and their effects on the environment i found Pubmed do be a very useful resource with many reliable articles enabling me to gain the knowledge i needed and create a plan for testing their effects on organisms.

Future steps:

In the future I would like to be able to pull consistent amount of the solution so that I can see the same number of organisms each time. I also hope to further my skills in looking at the FOV and determining the size of the cells I am observing.

Storage:

The microscopes that we used were stored in their spots on the table covered and turned off. The micropipettes we used were returned to their rack along with the slides being returned to the concave slide box. We then wiped the table of anything that we saw and returned the pipette tips and well-box of tetrahymena to their original spots. The plates we used to pipette water on were also dried off and placed back in their original positions on the table.

September 7

Lab 3: Compound Microscope Ciliate Challenge

Print Friendly, PDF & Email

Objective:

The objective of this experiment was to familiarize ourselves with compound microscopes and their functions. We learned how to measure the field of vision on the compound microscope and measure our ciliates using the FOV measurements we took. Observe ciliates under microscope with iodine and methyl cellulose.  We also learned how to use the tree of life to identify various ciliates.

Procedure:

  1. Used the compound microscope to familiarize ourselves with the 4x, 10x, and 40x magnification.
  2. Use sample slide as practice for focusing and light control.
  3. Measured our field of vision with ruler.
  4. Added a drop of ciliates with a pipet to a cover slip and placed to on a depression slide.
  5. Used FOV measurements to measure the ciliates
  6. Used iodine to stain the ciliates and methyl cellulose to slow them down.
  7. Clean up work space and wash off slides.
  8. Turn off and put away microscopes.

Materials:

  1. Compound Microscope
  2. Unknown Ciliates
  3. Pipet
  4. Iodine
  5. Methyl cellulose
  6. Depression Slide
  7. Cover slip
  8. Ruler

Table/FOV Measurements:

Diameter in mm Diameter in μm
4x 4 mm 4000 μm
10x 1.6 mm 1600 μm
40x 0.4 mm 400 μm


Unknown Hanging on cover slip Stain #1 (Iodine) Methyl Cellulose
Movement Worm like movements that are slow and contracted No Movement Slow Movement
Shape Long Thin Oval Long Thin Oval Long Thin Oval
Size 0.25 mm 0.25 mm 0.25 mm
Characteristics Transparent Dead Slow and close to death


Conclusion:

In this lab I learned how to proficiently use a compound microscope and adjust the microscope so that I was able to view the necessary unknowns. We also were able to identify the unknown ciliates and categorize them based on their characteristics. When Iodine was used we watched as the ciliates dies and when methyl cellulose was used we watched them slow down drastically. I also learned how to use FOV to roughly estimate the size of the organism I was viewing and better understand what I was viewing. I learned how to use depression slides effectively and the necessary size of drops used to fit within the depression slide.