November 16

Lab 13: Ciliate Isolation and Characterization

Print Friendly, PDF & Email

11/15/18

Purpose:

The purpose of this lab was to fid the soil texture of our soil sample using percent composition of clay, silt, and sand. Also, a purpose was to find and identify a ciliate in our sample.

Procedure:

  1. Retrieve the test tube of soil that were stored to separate the mixture.
  2. Measure each cm of clay, silt, and sand. Take the percentage to find the soil texture.
  3. Retrieve the non-flooded plate if a ciliate has been found. Retrieve a sample jar if none have been found.
  4. Micropipette 5 10uL drops onto a concavity slide. Micropipette a 10uL drop of water onto each drop to dilute it.
  5. Search for ciliates under a dissection microscope and micropipette any ciliates seen to isolate if any are found.
  6. If one is found, take a picture and video. Record any seen characteristics.

Data/Observations:

cm Percent composition
Total 5.4
Silt 1.0 19%
Sand 2.3 43%
Clay 2.1 39%

Texture= clay loam

No ciliates were found. A microscopic water bug and a small worm were viewed.

Conclusion:

The microscopes were covered and put away. The petri dishes and jars of sample soil were returned to their bins. The concavity slides were washed. Micropipette tips were thrown away. I was able to understand how to dilute soil in order to find ciliates more easily. Although no ciliates were found, I was also able to see the diversity in microscopic organisms as I was able to view other organisms, such as microscopic bugs and worms. The soil sample texture was also able to tell me much about the types of organisms that live in that particular soil environment. I think, when combined with class data, it will be telling of the diversity of soil and how their environment is dependent of soil texture.

November 9

Lab 12: Ciliate Classification

Print Friendly, PDF & Email

11/9/18

Purpose

The purpose of this experiment is to begin finding the texture of our soil as well as to observe ciliates in the sample. Looking at soil texture can help evaluate the type of soil environment in which our found ciliates live. Discovering ciliates and identifying them helps us see the biodiversity of our soil.

Procedure

Part 1: Ciliates

  1. Micropipette 5uL of water and place it onto a concavity slide. Repeat 4 times for a total of 5 per slide.
  2. Micropipette 5uL of the soil sample from the non-flooded plate onto each water droplet.
  3. Observe the concavity slide using the dissecting microscope.
  4. Look for small microorganisms that could be considered ciliates.
  5. If a ciliate is found, take a picture and video of the ciliate under the microscope. Isolate the ciliate into a smaller area for better viewing if necessary.
  6. Identify the ciliate if one is found.

Part 2: Soil Texture

  1. Use a tablespoon to take 4 mL of soil sample from the non-flooded plate and insert it into a falcon tube.
  2. Fill the rest of the tube with water until the 10 mL mark is reached.
  3. Then, add one drop of sodium pyrophosphate.
  4. Centrifuge the tube to mix the contents.
  5. Place the tube in a rack to allow the mixtures to separate so that the contents can be measured to determine the texture.

Observations

No one in our group was able to find a ciliate. I did find one worm and one bacterium.

Conclusion

The soil was placed in a tub and the slides were washed with bleach. The microscopes were returned to their original place and covered. The falcon tubes were put on a rack for the soil to settle. Although no ciliates were found, the other organisms viewed helped to show the biodiversity that can exist at the microscopic level. The process of viewing my soil sample helped me to come up with the best way to dilute my soil so that the ciliates could be most easily viewed.

November 2

Lab 11: Soil Ciliate Discovery; Soil Metadata 1

Print Friendly, PDF & Email

11/1/18

Purpose

The purpose of this lab is to find the pH and water content of soil as well as observe and try to identify ciliates. A non-flooded plate will be used to find the ciliates.

Procedure

  1. Subtract the dry sample weight from the original weight of the wet sample and divide by the wet sample weight to get the percent water composition.
  2. Add a small amount of the soil with water from the sample into a small tube.
  3. Centrifuge the tube for 30 seconds.
  4. Remove 3mL of water from the tube and place it on the lid of the petri dish.
  5. Submerge a strip of pH paper in the drop. Record the color of the paper after a minute.
  6. Observe the soil sample under a dissecting microscope.
  7. Push the soil around and swirl the water in the petri dish to look for ciliates.
  8. If none are found, transfer a small amount onto a concavity slide.

Data/Observations

pH=6.8

Water content=20.32%

No ciliates found.

Conclusion

The microscopes and micropipettes were returned to their original place. The micropipette tips, plastic pipettes, and small plastic tubes for centrifuging were thrown away. The lid was put back on the petri dish of the soil sample and the samples were stored. I did not find any ciliates in my sample, but I was able to focus my microscope on the sample and will be able to find the ciliates in a later class when they come out of their cysts. I saw organisms other than ciliates, such as unidentified bacteria and worms, so I was able to see some of the diversity in a microscopic soil environment.

October 19

Lab 9: Results and Figures

Print Friendly, PDF & Email

10/18/18

Purpose

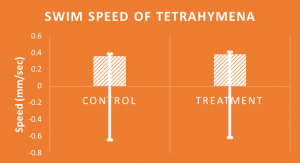
The purpose of this lab was to learn how to create graphs using Excel to display the data from our research experiment correctly. We learned which graphs are useful for the statistics received from the results of our experiment.

Procedure

  1. Organize the class information for the cell counts, optical density, and your assay (swim speed) into columns by treatment and control.
  2. Using excel, highlight the columns for the cell counts and pick a graph that most accurately represents the point of your data.
  3. Use titles, units, and standard error to complete the graph.
  4. Repeat the process for the optical density.
  5. Repeat for your own assay (swim speed).

Data/Observations

Conclusion

The lab helped to learn which graphs are most useful for different data sets. Although I used a bar graph, I did it because I felt that it most accurately represented the point of the experiment. The graphs allow readers of our research papers to most easily analyze the information. The graphs also allow me to give information in the research section to explain in the discussion section of the research paper.

October 12

Lab 8: Data Analysis

Print Friendly, PDF & Email

10/11/18

Purpose

The purpose of this lab is to learn the ability to perform Excel statistical analysis, including descriptive statistics, histograms, F-tests, and T-tests. The data for this experiment will be used in our research papers to prove if or how microplastics in green twine juice affect Tetrahymena cell count or assays. As I performed the swim speed assay, that is the one that I will analyze.

Procedure

  1. Open the Excel for the class with Canvas, make sure that the Data Toolpak is installed, and record the results of your cell count and assay under your name.
  2. Open a separate Excel and record the cell count and assay information for all of the data. Separate the data into control and treatment columns for cell count and swim speed.
  3. Find the descriptive statistics for each column.
  4. Use a histogram by labeling bins for each control or treatment. Be sure that most of the bins are filled.
  5. Create a F-Test Sample for Variance using the control and treatment. Compare the F values to reject or accept the null hypothesis.
  6. Create a T-test using the control and treatment.
  7. Save the Excel sheet.

Data/Observations

Conclusion

A correlation between the treatment and cell count was apparent as the mean of Tetrahymena was greater in the treatment solution. Also, the mean speed in mm/s was larger in the treated solution. This data was unexpected as the results were hypothesized to be much lower in terms of speed and cell count in the treatment.

It would be helpful to become more efficient with the Excel Toolpak. Also, in the future, it may be helpful to observe the changes in Tetrahymena observed with different sizes or different kinds of microplastics to determine which affect Tetrahymena the most.

October 5

Lab 7: Materials and Methods

Print Friendly, PDF & Email

10/4/18

Purpose

The purpose of this experiment was to test the effect of microplastics on Tetrahymena using cell count, assays, and optical density on two media’s-one with twine juice, one control. Groups of two completed these experiments, with one person doing control and the other doing treatment. I did treatment. Also, a lysosomal, swim speed, and swim direction were completed. My partner and I completed the swim speed assay, with me once again using the treatment media. This experiment is a part of our research project and will be combined with class information. It will give results on the effects of polypropylene (found in baling twine) on the soil environment using Tetrahymena.

Procedure

Part 1: Optical Density

  1. Two vials of sample (control and treatment) are labeled.
  2. 5mL of each media are transferred using a serological pipette.
  3. The medias are taken to a machine to record their optical densities at a wavelength of 600nm.

Part 2: Cell Count

  1. 3 drops of 2uL sample (one person for each sample) are pipetted onto a concavity slide.
  2. 1uL Iodine is pipetted to each drop.
  3. The slide is placed on a compound microscope and focused upon.
  4. The cells in each drop are counted and recorded.

Part 3: Assay (Swim Speed)

  1. 20uL of a sample (one person for each sample) is pipetted onto a concavity slide.
  2. A ruler is placed onto a dissecting microscope so that the mm marks are viewed easily.
  3. The slide is placed on top of the ruler and focused upon.
  4. With a timer, a cell is timed by how long it takes to move from one mm mark to the next.
  5. Repeat step 4 9 more times.
  6. Record each time as mm/sec.

Data/Observations

Part 1: Optical Density

Media Control (PPT, TH) Treatment (PPT, TJ, TH) PPT, TJ PPT
Optical Density 0.020 0.134 0.057 0

Part 2: Cell Count (Treatment)

Droplet 1 2 3
Cells counted (2uL) 68 102 118

Part 3: Swim Speed Assay (Treatment)

Cell 1 2 3 4 5 6 7 8 9 10 Average Standard Deviation
Mm/s 0.61 0.38 0.67 0.81 0.63 0.43 0.97 0.64 0.79 0.83 0.68 0.18

Conclusion

The optical density of the treatment was clearly shown. Also, I noticed that the cell counts seemed to be much larger in the treated solution. The experiments of treated samples, when compared to the control samples, will tell us much about the effects of polypropylene on Tetrahymena. This, in turn, will tell what effects it can have on a soil environment as a whole and what is happening to the land when baling twine is used. In the future, we will use this data to collect results for the experiment and find more specific statistics about the effects of polypropylene.

September 28

Lab 6: Experimental Design and Preparation

Print Friendly, PDF & Email

9/27/18

Purpose

We will prepare the twine to be broken into microplastics by cutting it and mixing it with sterilizing solution. This will be performed in order to conduct the next experiment on the effects of microplastics on Tetrahymena. Then, we will count the Tetrahymena cells per mL using Iodine and concavity slides. This is a simple cell count that teaches basic laboratory and calculating skills. Finally, we will conduct one of three assays to test the lysosomes or behavior of the Tetrahymena. One will do the vacuole formation assay, simple swim speed assay, or direction change assay. This will help us find more basic details of Tetrahymena before conducting our class experiment.

Procedure

Part 1: Twine

  1. Cut the twine into many, small parts for absorption.
  2. Weigh a weighing boat on a scale. Add 0.5g of twine to the boat.
  3. Transfer the twine to a glass jar.
  4. Use a graduated cylinder to measure 50mL of solution and mix.
  5. Place the jar near the microwave to be heated.

Part 2: Cell Count

  1. Micropipette 20uL of Tetrahymena on a petri dish lid.
  2. Micropipette 5uL of Iodine and add the droplet to the 20uL of Tetrahymena.
  3. Micropipette up and down to mix the solutions.
  4. Obtain 3 5uL drops and place them on concavity slides without a cover.
  5. Use a compound microscope at 4x to view the Tetrahymena. Count the number in each 5uL drop.
  6. Calculate the average number and record the cells per mL.

Part 3: Simple Swim Speed Assay

  1. Place a 20 µl drop of culture on a clean flat slide.
  2. Set the slide on top of a metric ruler and adjust the slide so that you can see the cells on top of the mm marks on the ruler.
  3. Pick a cell to watch and line it up with the inside of one mark.
  4. Start the timer and watch the cell until it touches the inside of the next mark. Stop the timer.
  5. A stopwatch can be started whenever a cell passes over one of the marks and stopped when the cell touches the next mark, but this is easier if you have one person watching and saying “Go” and “stop” to a partner. Only cells swimming straight during the entire length of the mark should be included.
  6. Record the time and repeat for at least 10 cells.
  7. Swim speed can be expressed mm/s.
  8. Calculate the Average and the Standard Deviation.

Data/ Observations

Part 2:

Drop 1 Drop 2 Drop 3 Average /5uL Average /mL in Dilution (5)
46 44 44 44.7 44,700

Part 3:

Cell 1 2 3 4 5 6 7 8 9 10
Sec 1.87 4.33 4.29 3.73 2.69 2.86 2.45 3.06 2.26 3.18

Average= 3.07 sec

Standard deviation= 0.79 sec

Conclusion

For part 1, the twine juice will be boiled and vortexed. The autoclave will sterilize the juice. Next week, the solution will be filtered for 5uL, so that the materials will qualify as microplastics as well as be small enough to be digested by the Tetrahymena. This lab taught me many basic laboratory procedures and calculations which will be helpful with future procedures. It prepares for the upcoming lab, but it also teaches about the basic Tetrahymena characteristics in the assays. The experiment was divided into separate parts which also helped me work on my time management.


September 21

Lab 5: Experimental Design and Serial Dilutions

Print Friendly, PDF & Email

9/20/18

Purpose

The purpose is to become acquainted with serial dilutions so that we may be able to use this skill in future experiments if necessary. Using serial dilutions, we will find the dilution with around 15-20 Tetrahymena and record the sample size in nanometers. We will then change that to find cells per mL. Next, we will research our experiments in order to form hypotheses and specific laboratory ideas that will contribute to the upcoming experiment.

Procedure

Part 1

  1. Collect soil in labelled plastic bags from 2cm deep soil near the creek and underneath a tree.
  2. Aquire and label a Petri dish.
  3. Weigh the bottom of a petri dish.
  4. Cover the bottom of the petri dish with soil and weigh it again.
  5. Cover the dish and put in a fume hood.

Part 2

  1. Observe the Tetrahymena in a stock using a dissecting microscope.
  2. Add 900 microliters of the culture to 4 separate wells in a well plate.
  3. Add 100 microliters of undiluted culture to the first well. Change the pipette tip.
  4. Add 100 microliters of well plate 1 to well plate 2. Change the tip.
  5. Continue step 9 with well plates 3 and 4 so that the dilution is performed in number oil and the tips are changed between steps.
  6. Observe the wells under a dissecting microscope to find which has about 15 to 20 ciliates.
  7. Place 5 microliters of this well solution onto a concavity slide and view it under a compound microscope. Record.
  8. Find the cells per mL.

Part 3

  1. Move to the computer lab and login.
  2. Talk with your research team to develop a hypothesis and chemical design.
  3. Research ways to conduct your experiment and microplastics to use.
  4. Form an experiment that will work for the class, including specific class groups for different parts of the experiment and the kinds and costs of plastic required for the experiment.

Data/ Observations

Soil Mass:

Mass of petri dish in grams 6.8
Mass of petri dish and soil in grams 25.3
Mass of soil in grams 18.5


Serial Dilution Calculations:

Trial Dilution Cell Count in 5 microliters Cells per microliter Cells per microliter in undiluted sample Cells per mL in undiluted sample
1 10^0 22 4.4 44 44000
2 x x x x x
3 x x x x x
Average 44000

Description:

The Tetrahymena cells moved fairly quickly and were mostly alive. They were concentrated, but not overlapping.

Storage

The petri dishes with soil went in the fume hood to dry. The plastic bags with soil were placed in a bin. Concavity slides were rinsed and placed on paper towels. Micropipetter tips were placed in a cup on the lab taples. Microscopes used were turned off, unplugged, and covered.

 Conclusion

Serial dilutions were made easier to understand through the experiment. It will be helpful if needed in any future experiments. Also, the computer time gave me a good idea of what we will be doing in our future student-decided class lab, even if my groups’ is not picked. Finding details for scientific experimentation was proven to be a very critical part of the process and ended up altering our plan slightly.

September 14

Lab 4: Primary Literature and Experimental Design

Print Friendly, PDF & Email

9/13/8

Purpose

The purpose is to observe and learn about Tetrahymena. Also, we learn how to use micropipettes and how to research primary scientific literature to gain the best information for future experimentation.

Procedure

  1. Practice using the micropipettes by drawing and releasing water.
  2. Uncover and unplug the dissecting microscope and focus it.
  3. Place a 24 well plate under the microscope and observe the Tetrahymena.
  4. Use a micropipette to transfer 5 uL of the Tetrahymena sample from the well plate.
  5. Place the sample on a concavity slide and cover with a cover slip.
  6. Uncover and unplug the compound microscope.
  7. Observe the sample with the 4x and 10x view.
  8. Estimate the size of one cell. Record.
  9. Clean the equipment by instructor directions.
  10. In the computer lab, research articles for your future experiment.
  11. Form a future hypothesis and experimental design.

Data/ Observations

Trial Magnification Number of Cells Diameter of Cells in um
1 4x 20 50
2 10x 50 54
3 10x 55 48

Tetrahymena 10x Magnification:

Storage

The slides and coverslips were washed and placed on paper towels to dry. Both microscopes were turned off, unplugged, and covered.

Conclusion

This lab was helpful in viewing Tetrahymena for the first time and learning their basic characteristics, such as shape and size. Errors may occur in measurement of the diameters of the cells due to visual estimates of the cell size in comparison to the area of visibility. Micropipetting will be helpful with future experiments including, perhaps, the one we design. Talking as a group about the hypothesis we wanted to make and what we believe the experimental process forms a good basis for our future experiment. Learning about reliable articles and how to gain information that is useful from those articles is also important for our upcoming experiment as well as those after.

September 7

Lab 3: Primary Literature and Microscopy

Print Friendly, PDF & Email

9/6/18

Purpose

The purpose of this lab was to learn how to use compound microscopes and calculate a diameter for the field of view using one set of data and the field of view equation. We learned to make a wet mount with concavity slides and different stains to observe the ciliates in different ways and see their structure in detail. Learning these basic laboratory techniques will prepare us for future experiments and show us different and more efficient ways of looking at ciliates.

Procedure

  1. Obtain a compound microscope. Turn it on and get it into focus.
  2. Place a ruler under the lens at 4x magnification to determine the diameter in millimeters. Solve to find the diameter in micrometers. Use the field of view equation to find the diameters at 10x and 40x magnification.
  3. Obtain a 24 well plate with ciliates
  4. Look under the focused dissecting microscope to quickly find a sample with living, moving ciliates.
  5. Use a transfer pipet to collect a small sample from the well plate and place it on a concavity slide. Cover the slide with a cover slip.
  6. Place the slide under the lens and refocus with the fine adjustment at 4x, 10x, and 40x magnification to observe the ciliates.
  7. Place a drop of Methyl Green Pyronin Y onto the slide to slow the ciliates and observe again once replacing the coverslip.
  8. Clean the equipment and lab area per instructor directions.

Data and Observations

Magnification and Size Table:

Magnification Lens Diameter (millimeters) Diameter (micrometers)
4x 4.80 4800
10x 1.92 1920
40x 0.48 480

Ciliate Under Compound Microscope (Data at 40x Lens):

Specimen Number 4
Identification Paramecium
Size 4 lengths fit in one diameter (0.12 mm)
Drawing   
Picture  
Stain Methyl Green Pyronin Y
Stain Effects Sluggish movement, burst after 4 minutes, stain showed up greenish-blue, provided contrast to see ciliates in detail


Conclusion

From this lab, I learned how to successfully and efficiently use a compound microscope and how to calculate the field of view of a compound microscope. Learning the difference between dissecting and compound light microscopes will help me decide which one to choose on future experiments. I had the opportunity to see ciliates far closer up with the compound light microscope to observe and record more specific details. Also, I learned how to experiment using wet mounts and the way dye effects ciliates by slowing and bursting them.

Cleaning and Storage

The slide, coverslip, and well plate were rinsed. The well plate and slide were placed on paper towels and the coverslip was placed in a small cup to dry. Both compound and dissecting microscopes were turned off, unplugged, and covered.