November 15

Lab #13: Ciliate Isolation and Characterization 11/15/18

Print Friendly, PDF & Email

Objectives:

  • understand how to give a good presentation for the class
  • find ciliates in your soil collection and get texture of the soil
  • become familiar with the 11 classes of ciliates

Purpose:

The purpose of this lab is to find ciliates in your soil sample and be able to take a good picture and video to be able to present to the class. It is also to try and be able to identify what kind of ciliates you found.

Procedure:

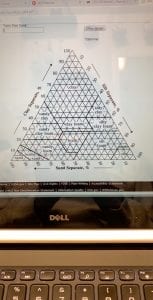
  • find the texture of the soil sample in the falcon tube by using a ruler to measure the amount of sand, silt, and clay at the bottom of the tube
  • find the percentages of the sand, silt, and clay and put it in the USDA website to find out your soil sample texture
  • if you haven’t found ciliates in your soil sample, continue to look for them, and if there isn’t any, use one of the soil samples from the bermuda grass that was collected to try and find the ciliates
  • once you’ve found the ciliates and have gotten a good picture and video, start figuring out the format of the group presentation

Data:

395D6B66-DB74-4966-B43F-F5F10A8B14E2-1nerlbu

Results:

I finally was able to find a couple of ciliates from the bermuda grass soil sample which is shown in the video shown above. My soil sample texture fell under the category of Loam.

Future Goal:

My goal for next lab is to get with my group and put together our presentation for the class and rehearse it with them, so we will be very prepared and in our time limit.


November 9

Lab #12: Ciliate Classification 11/9/18

Print Friendly, PDF & Email

Objectives:

  • learn the classes and super groups of ciliates
  • find the role of soil ciliates in the ecosystem
  • be more familiar with ciliates’ structures, functions, and taxonomy

Purpose:

The purpose of this lab is to discover ciliates in the soil we collected and to become more familiar with the characteristics and overall knowledge of the ciliates.

Procedure:

  • remove debris from the soil sample
  • add 4ml of soil in a Falcon tube
  • add water and mix it in the vortex
  • add 1 drop of dispersing agent and re-mix
  • observe the tube after 30 seconds and let the tube sit overnight until the next lab
  • look at the non-flooded plate and continue to find ciliates

Data:

9166C7E9-3F4A-47E3-8B23-88E7C3CE0330-23hlkuv

Conclusion:

I still have not found any ciliates in my soil yet, but in the video above, I circled a nematode that was swimming around. However, one of my lab partners thinks she has found a ciliate in her soil sample.

Future Goal:

My goal is to still try and find ciliates in my soil but also start our ciliate presentation.

November 1

Lab #11: Soil Ciliate Discovery 11/1/18

Print Friendly, PDF & Email

Objectives:

  • measuring soil characteristics and ciliate diversity and abundance
  • make a scientific presentation of our discoveries
  • determine pH of soil extract

Purpose:

The purpose of this lab is to start looking at the soil we collected and discover ciliates in the non-flooded dish. We are also finding the water content percentage of the soil.

Procedure:

  • to find the water content, weigh the soil sample and calculate the mass of water that has evaporated from the soil and convert this into a percent
  • use the equation (wet soil- dry soil x 100= % water
  • to find the pH, collect 500µL of soil water and put it in the spinner to shake the solution
  • put 100µL drop of the shaken solution onto a petri dish
  • put a pH strip in the drop and wait a minute or two to determine the pH
  • look through a compound microscope to try and find ciliates swimming around in the water around the soil
  • if you find ciliates, collect a drop and look at it in the dissecting microscope and take a picture

Data:

  • % water content- 10.625%
  • pH- 7.5

Conclusion:

I did not find any ciliates in the dish this time, but I did find a couple of worms and these clear bubbles which looked like it had little specks in it, almost like a sac of some sort.

Future Goal:

The goal of next time is to continue looking for ciliates in my soil sample and try to identify what kind of ciliates they are based on their size, shape, and other characteristics.


October 25

Lab #10: Results and Analysis 10/25/18

Print Friendly, PDF & Email

The introduction of the paper is background information of the topic of the research. The point of the introduction is to show the general idea of the topic and become more in depth on what has already been studied and how I am going to further my own research. It also gives the purpose of the methods and the results sections with a some commentary on the subject that the experiment was performed. The abstract gives some background information and the purpose statement from the introduction. It also gives a brief summary about the methods section along with the most important information about the results and a sentence about the conclusion. The purpose of the abstract is to give a general overall purpose of the whole research that is to follow this section of the paper. The materials and methods of the paper is the materials used in the experiment and the process of how we got the data and the techniques we used to get the data. The purpose of the methods section is to give an in depth description of the procedure of the experiment without using numbers to explain how you got the results. The results section includes the data of the experiment including the descriptives of the assays, the f-test information, and the t-test information with the histogram graphs and bar graphs. The purpose of the results section is to give the specific data to compare results and be able to make conclusions based on the numbers. The discussion in the paper includes the reproductive assay hypothesis discussion, the individual assay hypothesis discussion, the error, the future work, and the importance. The purpose of the discussion is to review all of the prior information to give an overall look-back of how everything turned out in the experiment. The conclusion of the paper includes the final verdict of the experiment. The purpose of this is to reject or accept the null hypothesis given at the beginning of the experiment and to back up why the variables reacted in the way they did. The acknowledgements and references are the resources that you used throughout the research paper. The purpose of this is to give credit to the people that gave the research and to not portray plagiarism.

October 19

Lab #9: Results and Figures 10/19/18

Print Friendly, PDF & Email

Objectives:

  • write the narrative of my results
  • use Excel to make a figure and graph

Purpose:

The purpose of this lab is to make graphs and figures for our results section in our research paper. It is to help us understand the standard error and effects on the Tetrahymena in the treatment.

Procedure:

  • create an Excel sheet and add a control and treatment column with the cell count numbers
  • go to the data analysis tool pak and create a descriptive statistics table for both the control and treatment
  • highlight the mean of the control and treatment and create a bar graph
  • add standard error lines and customize them by highlighting the standard errors on the tables and enter them
  • add the axis titles and graph name
  • you will do the same steps for the swim speed assay
  • for the optimal density, you need to calculate the optimal density of just the Tetrahymena which is the treatment- (PPT+twine extract)
  • you will create a descriptive statistics table for the control and Tetrahymena and do the same steps as before to get the bar graph and standard error

Data:

here’s the attached file of the data of the cell count, optimal density, and swim speed assay

bio lab 9-1t2tgay

Conclusion:

The conclusion is that the green twine extract caused the Tetrahymena to have a significantly lower optimal density than the control which is just the PPT with Tetrahymena.

Goal:

My goal for next time is to improve my research paper by adding more information in the methods section and start writing the introduction.

October 11

Lab #8: Data Analysis 10/11/18

Print Friendly, PDF & Email

Objectives:

  • use Excel to calculate the average and standard deviation of a set of data
  • use Excel to calculate the statistical differences between the means of 2 sets of measurements
  • turn in the draft of the Methods section of the research paper

Purpose:

The purpose of this experiment is to look at the data of the class and see how the green twine affects the Tetrahymena compared to the control which is just the PPT.

Procedure:

  • first I got the cell counts in cells/ml of the control and treatment from the whole class and put it in Excel
  • for both the control and treatment, go to the data analysis tool pak section of Excel and made a descriptive statistics table that includes the average, mean, etc.
  • make a bin range table for the histogram graphs for both the control and treatment
  • go to the data analysis section again and put the input as the cell count numbers and the bin range as the range you made for the control and treatment
  • the bin range must be a constant pattern in numbers for the x-axis
  • then go to the data analysis tool pak once again and click on the F-test two sample for variances
  • put the 2 variables as the control and the treatment of the cell count
  • you will then go back to the data analysis tool pak and click on the T-test: two sample assuming unequal variances and put the 2 variables as the control and treatment of the cell count
  • you will then do all of the steps above for the swim speed assay data

Data:
All of my data is on the Excel sheet I turned in on the QTM.

Conclusion:

The mean for the treatment was higher than the mean of the control which suggests that the green twine has affected the Tetrahymena in some type of way. In the swim speed assay, the mean for the treatment was lower than the mean for the control which means that the green twine caused the Tetrahymena to slow down once it has ingested the microplastics.

Goal:

My goal for next week is to further see how the green twine effects the Tetrahymena by looking at more data and becoming more familiar with the data analysis tool pack on Excel. I will also continue writing my research paper, so it will be the best it can be when it’s due.

October 4

Lab #7: Materials and Methods; Performing The Experiment 10/4/18

Print Friendly, PDF & Email

Objectives:

  • write the first rough draft of the materials and methods portion of research paper
  • start the experiment by comparing the control solution to the treatment solution
  • think about how assays are important to the experiment

Procedure:

  • get two tubes and fill one tube with the control group and fill the other with the treatment and look at the optimal density for both by going to the machine and making sure the transmittance is at 100
  • get three drops of 2ul of Tetrahymena and 1ul of Iodine and mix them together and get the cell count using a dissecting microscope
  • once you have finished that, start the swim speed assay
  • line up a millimeter ruler with a 20ul drop of Tetrahymena under a dissecting microscope
  • find a cell and time it from the time it takes to get from one tick to the next
  • do that for 10 trials making sure that the cell goes straight across without changing directions
  • you will do the swim speed assay for both the control and the treatment
  • compare the data with your partner and put it in the class data table on Excel

Data:

  • Cell Count for Control:
    • 17 cells
    • 8 cells
    • 29 cells
    • Average: 18 cells
  • Cell Count for Treatment:
    • 22 cells
    • 10 cells
    • 8 cells
    • Average: 13 cells
  • Optimal Density:
    • absorbance for control- 0.058
    • absorbance for treatment- 0.155
  • Swim Speed Assay
Trial # Speed for Control Solution (seconds) Speed for Treatment Solution (seconds)
1 3.4 3.31
2 4.36 4.79
3 3.79 3.88
4 2.99 3.95
5 3.07 3.46
6 2.74 2.43
7 3.2 3.25
8 2.99 3.61
9 2.82 3.33
10 3.07 3.26

Average for Control: 3.243s

Average for Treatment: 3.527s

Conclusion:

In the data above, you can see that the average speed for the control was a little faster than the treatment probably because of the twine juice that is in the solution.

Future Goal:

My future goal is to start preparing and writing my rough draft of my research paper, so I can get a full understanding of what I’m doing and make sure I’m doing everything correctly.


September 28

Lab #6: Experimental Design and Preparation 9/28/18

Print Friendly, PDF & Email

Objectives:

  • describe the possible effects of microplastics in soil on Tetrahymena
  • use calculations to find the cell count of the Tetrahymena and cells/ml
  • figure out the dilutions required to make a diluted solution from the stock solution
  • use Excel to calculate the average and standard deviation of a set of numbers

Procedure:

  • measure 0.5g of Polypropylene into a sterile glass jar
  • add 50ml of stenie proteose-peptone-tryptone media
  • add 20ul of Tetrahymena to 5ul of Iodine on a petri dish and mix it
  • add 3 5ul drops on a slide
  • look in a compound microscope and try and count the cells
  • if too many, dilute the solution by adding 5ul of the first drop into 45ul of PPT media and mix

Procedure for Swim Speed Assay:

  • place a 20ul drop of Tetrahymena on a slide
  • put slide on top of a ruler and adjust on a dissecting microscope to see the millimeter marks on the ruler
  • pick a cell and wait til it is lined up with a tick on the ruler and time it to see how long it takes to the next tick
  • if the cell starts moving in a different direction, then you have to find a new cell and start over
  • time at least 10 cells
  • calculate the average and standard deviation

Data for Solution:

before dilution                      after dilution

had to dilute solution to 1:10

drop 1- 280 cells

drop 2- 4 cells

drop 3- 140 cells

average- 141 cells

calculation: (141/5ul) x (50) x (1000)= 1,410,000 cells/ml

Data for Swim Speed:

  1. 2.16s
  2. 1.43s
  3. 1.68s
  4. 1.63s
  5. 2.30s
  6. 1.56s
  7. 2.10s
  8. 2.28s
  9. 1.88s
  10. 1.98s

Average: 1.9s

Standard Deviation: 0.31

Future Goal:

My goal for next week is to be able to figure out an experiment dealing with the twine that we are using to see how it affects the stock Tetrahymena over a period of time.


September 20

Lab #5: Experimental Design and Serial Dilution 9/20/18

Print Friendly, PDF & Email

Objectives:

  • practice pipetting
  • serial dilutions and concentration calculations
  • get in new group and come up with question and falsifiable hypothesis

Procedure:

  • look through a dissecting scope at stock Tetrahymena
  • put 900ul of Tetrahymena culture media in 4 wells using a pipettor
  • take 100ul of the stock Tetrahymena and put it in the first well
  • take 100ul from the first well and put it in the second well
  • take 100ul from the second well and put it in the third well
  • take 100ul from the third well and put it in the fourth well
  • look through the 4 diluted wells and pick a well that has the best cell count concentrate
  • transfer 5ul of your preferred concentrate onto a concavity slide and observe it under a compound microscope
  • count the Tetrahymena on the slide and do the calculations in the table below
  • once you’re done, go with your group and come up with a question and hypothesis for the research project
  • go online and find microplastics small enough so that the Tetrahymena will be able to eat it
  • come up with an experimental design for the research and turn in the QTM

Data:

Trial Dilution: Which dilution did you use to make your counts? Cell count in 5ul Cells per ul in the drop (/5) Cells/ul in the undiluted sample (x dilution factor) Cells/ml in the undiluted sample (x 1000 ul/ml)
1 10^-2 9 1.8 180 180,000

Method:

  • 3 soil samples with Tetrahymena
    • 1 is control with 20g of soil
    • 1 is 1:10 concentration of acrylic with 20g of soil
    • 1 is 1:5 concentration of acrylic with 20g of soil
  • timing is over 24 hours
  • after 24 hours count the total amount of Tetrahymena and the deaths and subtract them to get the reproduction count
  • using the Giga piment powder G28 0.25oz/7.087g- $8.50

Future Goal: 

My next goal is to set up the experiment and continue to do trial and error runs with the acrylics.


September 13

Lab #4: Meet Tetrahymena 9/13/18

Print Friendly, PDF & Email

Goals:

  • practice microscopy
  • learn to use pipettor
  • meet Tetrahymena
  • literature research

Procedure:

  • Observe the Tetrahymena in the well-plate using the dissecting microscope
  • Use the pipettor to get 5 macroliters of the cells and put it on a concavity slide
  • Look at the slide through a compound microscope
  • Observe it through the 4x, 10x, and 40x and observe the ciliates

Data:


Trials # of cells in 5 macroliters Approximate Diameter
1 (4x) 100 about 50 cells across
2 (10x) 45 about 20 cells across
3 (40x) 20 about 8 cells across

Future Goals: 

I am hoping that I can make an experiment to see how microplastics affect soil by using Tetrahymena. I am going to do that by looking at the reproduction rates of the Tetrahymena over a period of 24 hours and see how much the microplastics affect it.