January 25

Lab 2: Presentations and Soil Collection

Print Friendly, PDF & Email

Mackenzie Singer

1/24/19

Purpose:

The purpose of this lab was to present information on metabarcoding to the class because we will be using the procedure throughout the semester. We also created non-flooded plates from the soil we collected that we can use later in the lab and tested the pH levels of our non-flooded plates.

Procedure:

Soil Collection:

  1. Designate a tree on campus to collect soil from.
  2. Take pictures of the full tree, the leaves, and the collection site.
  3. Use a spoon and dig about 1-2 inches deep into the soil and place it in a plastic bag.
  4. Fill out the data sheet with the tree’s information and submit it to canvas.

Non-Flooded Plate:

  1. Obtain a large petri dish and weigh it without a lid. Record mass in grams.
  2. Pour enough soil into the petri dish so that the bottom is fully covered.
  3. Add DI water using a pipette, making sure that the water covers all of the soil but isn’t over-flooded.
  4. Weigh the petri dis containing soil. Record in grams.
  5. Use a dissecting or compound microscope to observe and take note of any organisms in the soil.

Soil pH:

  1. Fill a test tube with 3mL of soil.
  2. Fill the test tube with water up to the 8mL line.
  3. Shake the tube for at least 3 minutes.
  4. Pipette about 1mL of water from the falcon tube and move it to a falcon tube
  5. Centrifuge the falcon tube for a minute.
  6. Take a pH strip and place it in the falcon tube. Let sit for one minute.
  7. Compare the color of the strip to the colors on the package. Record the pH value.

Data and observations:

Empty petri dish 5.8g
Petri dish with soil 32.6g
Soil pH 6.0

Storage:

Petri dishes were labeled and placed at the back of the lab. The soil test tubes were placed into a storage rack. All microscopes were unplugged and covered. Used falcon tubes and pipettes were thrown away.

Conclusion and future steps:

I am very excited to observe the DNA of ciliates and trees around campus throughout this semester. I was very interested in the presentations and ways to observe DNA. I could not find any organisms in my soil, but I am hoping that a closer look in next week’s lab will allow me to find ciliates.

October 19

Lab 9: Results and Figures

Print Friendly, PDF & Email

Mackenzie Singer

10/18/18

Lab 9

Objective:

The purpose of this lab was to become comfortable making graphs and using them to analyze data. We used Microsoft Excel to input our data and create figures to make a visual representation of the results.

Procedure:

  1. Open the Excel sheet containing all of the class data.
  2. Copy and paste the cell counts for control and treatment into a new document.
  3. Highlight the columns of data and click on the recommended charts button. Select the chart you think best represents the data.
  4. Give the chart a title and add axis titles.
  5. Add the standard error bars by clicking the chart design button, selecting add chart element, and clicking the error bars and standard error. Double click the bars and select custom in the right column that pops up. Put the values from last week’s descriptive statistics box for control and treatment.
  6. Repeat these steps with the results from optical density.
  7. Make the chart for cell count and optical density into a JPEG and upload to canvas.
  8. Repeat steps with your behavioral assay.

Data:

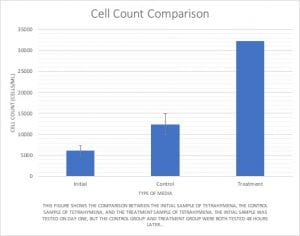
Cell count:

Optical Density:

Swim Speed Assay:

Conclusion and Future Steps:

This lab was very important in making us more comfortable with looking at a chart to compare results. It was very beneficial because we could use a visual to see how the treatment effected the tetrahymena. Future steps will be to use the data and observations to create a lab report on the effects of polypropylene on tetrahymena.

October 5

Lab 7: Assays and Twice Juice Data

Print Friendly, PDF & Email

Mackenzie Singer

Lab 7

10/4/18

Objectives:

The purpose of this lab is to use the assays we practiced in lab last week to observe the treatment of twice juice on tetrahymena. We also were able to become comfortable using the serological pipette to get samples of culture. The purpose of the experiment is to see if the microplastics in the hay baling twine effect organisms in the ground. If the organisms are harmed, it will prove that the microplastics are harmful to the environment on the microscopic and macroscopic levels.

Procedure:

Prior to this lab, Dr. Adair and the TAs prepared and observed the growing tetrahymena twine juice solution.

Cell Count:

  1. Obtain a flask of 50 mL brown twice juice solution.
  2. Aseptically transfer 40 mL of treatment and control into separate sterile test tubes. Keep tubes in a test tube rack.
  3. Observe the two solutions with a spectrophotometer and record the results in a lab notebook.
  4. Use a micropipette to transfer three 2 µl drops onto a clean slide and then add 1 µl of iodine to each drop.
  5. Observe the drops and count the number of cells in each and record in lab notebook.

Swim Speed Assay:

  1. Place a 20 µl drop of tetrahymena twine juice solution on a clean flat slide.
  2. Set a metric ruler in the field of view on the microscope at 4x. Adjust the slide so that you can see the cells over marks on the ruler.
  3. Choose one cell to watch and line it up with the inside of a mark.
  4. Start a stop watch when a cell hits the mark and stop the time when it reaches a distance of 10 marks away. Only cells swimming straight should be included.
  5. Record 10 cells.
  6. Repeat with a 20 µl drop of control solution on a separate slide. Record in lab notebook.
  7. Swim speed can be expressed as mm/s.

Data:

Absorbance:

Culture Absorbance
Media 0
Control 0.010
Twine Juice 0.077
Treatment 0.072

Cell Count:

Culture Cell Count (average)
Control 27
Treatment 50

Swim Speed Assay:

Control

Cell # Time (sec) Speed (mm/s)
1 1.05 0.19
2 0.93 0.22
3 0.93 0.22
4 0.95 0.21
5 0.93 0.22
6 0.90 0.22
7 1.35 0.15
8 1.00 0.20
9 1.21 0.17
10 1.32 0.15

Treatment

Cell # Time (sec) Speed (mm/s)
1 0.70 0.29
2 0.76 0.26
3 0.61 0.33
4 0.62 0.32
5 0.53 0.38
6 0.48 0.42
7 0.55 0.36
8 1.08 0.19
9 0.91 0.22
10 1.15 0.17

Storage:

The microscopes were covered and placed on lab tables. Slides were washed off and laid out to dry. The test tubes containing control and treatment solution were covered and placed on the back table for use during open lab.

Conclusion:

We used the twine juice and behavioral assays in order to test the effect of microplastics on tetrahymena. We were also able to practice experimental design with the pre-lab which is essential for bio research. We also practiced using serological pipettes, which will be important for future labs. Future steps of these assay experiments will be used when we evaluate the microplastics in soil in our own experiments.

September 28

Lab Experiment Design and Preparation

Print Friendly, PDF & Email

Mackenzie Singer

Lab 6

9/28/18

Objectives:

The purpose of this lab is to familiarize students with procedures that will be used in future labs involving tetrahymena and microplastics. We divided up the different testing procedures so that one student in each group understands how to do the lab. It also helped us get more comfortable with dilutions.

Procedure:

PP Microplastic Production

  1. Cut polypropylene (PP) into small pieces.
  2. Weigh out .5 g of PP and put it in a glass jar.
  3. Add 50 mL of protease-peptone-tryptone (PPT) into the jar.
  4. Boil and stir/vortex for the entire lab.
  5. Filter using 50 µm filter paper into sterile 50 mL tube.
  6. Autoclave “twine juice” and store for the next week.

Ciliate Count Challenge

  1. Add 20 µl of tetrahymena to 5 µl drop of iodine in a petri dish.
  2. Mix by pipetting up and down.
  3. Place three 5 µl drops of the iodine solution onto a clean slide.
  4. Under a compound microscope at 4x magnification, count the number of Tetrahymena in each droplet.
  5. If cell count is over 50, dilute it 1:2 to make it easier to count by adding 25 µl of PPT to 25 µl of tetrahymena. (my group’s dilution factor)
  6. Count the cells and record in lab notebook.

Direction Change Assay

  1. Add a 5 µl drop of tetrahymena culture to a clean flat slide.
  2. Observe the slide under a dissecting microscope. Use the slide over the black plate and under the reflecting light.
  3. Choose a cell to follow for 10 seconds. Use a timer to keep track of time.
  4. Count how many times the cell changes direction in the 10 second time span. Record in a chart in your lab notebook.
  5. Repeat steps 3-5 for 10 cells.
  6. Find standard deviation.

Simple Swim Speed Assay

  1. Place a 20 µl drop of tetrahymena culture on a clean flat slide.
  2. Set a metric ruler in the field of view on the microscope at 4x. Adjust the slide so that you can see the cells over marks on the ruler.
  3. Choose one cell to watch and line it up with the inside of a mark.
  4. Start a stop watch when a cell hits the mark and stop the time when it reaches a distance of 10 marks away. Only cells swimming straight should be included.
  5. Record 10 cells.
  6. Swim speed can be expressed as mm/s.

Vacuole Assay

  1. Place 20 µl of tetrahymena culture on a clean concavity slide.
  2. Add 1-5 µl of India ink to the drop of cells and pipette up and down to mix the cells and ink.
  3. Place the coverslip over the drop and use 400x magnification on a compound microscope. Start a timer. Scan the slide for 10 cells and count any lysosomes. This is time=0.
  4. After 10 minutes, count the number of lysosomes for at least 10 cells.
  5. Repeat the procedure for 20 and 30 more minutes.

Data:

Cell Count: 34 cells in 2 µl 1:2 diluted drop.

Directional Assay:

Cell # of times cell changed direction
1 5
2 5
3 5
4 4
5 4
6 3
7 4
8 4
9 6
10 4
Average 4.4
Standard Deviation 0.84

Speed Assay

Cell Time Speed
1 .81 sec .0247 mm/sec
2 .92 sec .0217 mm/sec
3 .81 sec .0247 mm/sec
4 .53 sec .0477 mm/sec
5 .88 sec .0227 mm/sec
6 .60 sec .0333 mm/sec
7 .58 sec .0345 mm/sec
8 .58 sec .0345 mm/sec
9 .83 sec .0241 mm/sec
10 .99 .0202 mm/sec


Vacuole Assay

Cell # vacuoles (0 mins) # vacuoles (10 mins)
1 1 2
2 1 3

(My group member did not have enough time to complete the entire procedure, and only recorded 2 of the cells.)

Storage:

The “twine juice” was stored in jars for next week’s lab. The used tetrahymena solutions were disposed of and slides were washed and set out to dry. Microscopes were put away properly on lab table.

Conclusion/Future Steps:

This lab was useful to help us understand the procedures we will be doing in a future lab to test the tetrahymena. I became much more comfortable with the dilutions and using the micropipettes. The steps used in this lab will be extremely important when we use them to test the effect of the microplastics on tetrahymena. One thing that would be essential to fix is timing because not everyone was able to complete their full procedure.

September 14

Meet Tetrahymena

Print Friendly, PDF & Email

Mackenzie Singer

Meet Tetrahymena-Lab 4

9/13/18

Objective:

The purpose of this lab was to introduce students to the tetrahymena that will be used for future research and experiments during the semester. We also practiced using the micropipettes so that we can get comfortable using them for future procedures.

Procedure:

  1. Obtain a 24-well plate and transfer 100 ul of tetrahymena stock into a single well using a micropipette.
  2. Observe the tetrahymena using a dissecting microscope.
  3. Using a P-10 micropipette, pick up 5 ul of tetrahymena.
  4. Transfer the 5 ul of tetrahymena into a concave slide.
  5. Observe the tetrahymena under a compound microscope under 4x and 10x objective lenses. If 40x is needed, use a cover slip over the well.
  6. Count the number of tetrahymena in the 5 ul solution. Record in lab notebook.
  7. Using field of view measurement, find the relative size of the cells. Record in notebook.
  8. Record any other observations in notebook along with a sketch.

Observations:

Trials /Number of cells in 5 ul Approximate diameter of cell Picture
1 200 5um

Storage:

For this lab, we did not label or store any of the used samples. The used solution was kept in a 24-well plate and the micropipettes and microscopes were kept on the lab tables.

Conclusion:

The dissecting and compound microscopes give very different views of the tetrahymena. It is much easier to observe them close up with the compound microscope and on a large scale with the dissecting microscope. Future steps I would take with tetrahymena is to use the organism to perform more advanced experiments in the future, as it will be our model organism.

Computer Lab:

In the computer lab, my group read articles on tetrahymena and thought of a hypothesis to test for soil tetrahymena. In marine environments, microplastics pose a threat to the growth rate of organisms by reducing the rate. We want to test if the microplastics reduce growth rate in soil environments also. We will use microplastics containing BPA placed in soil with tetrahymena versus a control tetrahymena in soil with no microplastics to decide whether growth rate is reduced in soil.