Lab #14: Poster Presentation and Abstract Submission

Sara Rothrock
4/25/2019
Purpose:
The purpose of this lab was to enter the metadata we collected this semester to determine which samples to sequence, to edit our poster presentations and write an abstract with our groups.
Procedure:
- Vote on a logo for stickers and t-shirts
- Enter the metadata we collected into the class excel sheet
- Revise our poster and write our abstract
Metadata:
| Sara Rothrock, Rebekah Gerry, Andreea Loghin | 22 | 7 | GLR22_7Sp19 | -97.1195413, 31.5495435 |
Quercus Virginiana |
55.0064 | 6.5 |
Loamy sand |
Silica bead |
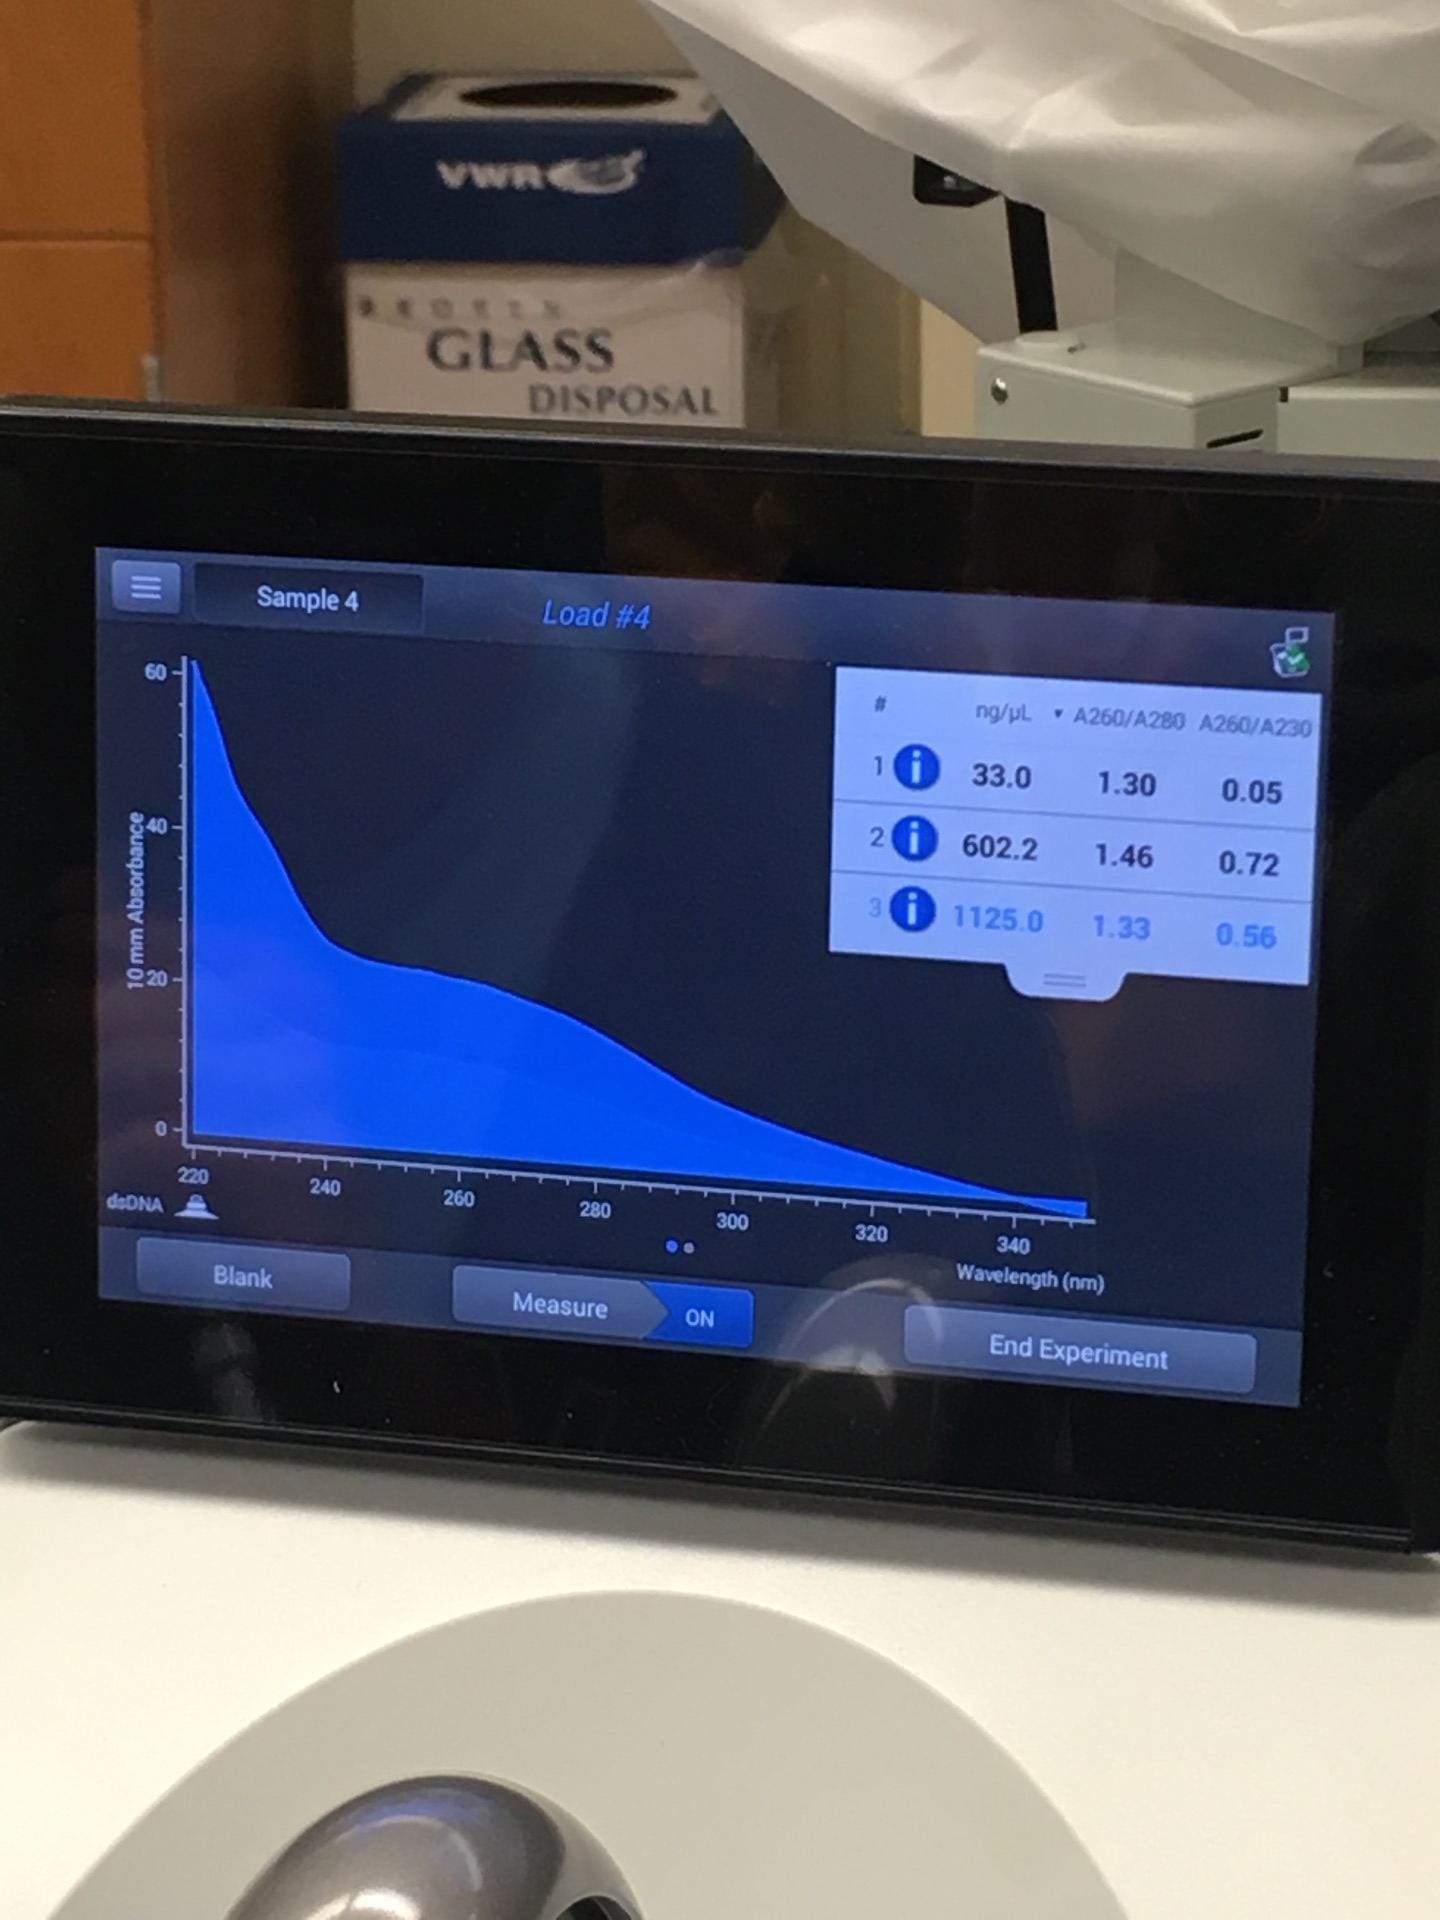
1125 ng/ul |
30 | + | GLR22_7Sp19 |
Abstract:
There are many standard methods for extracting Ciliate eDNA but not all are effective and cost efficient.
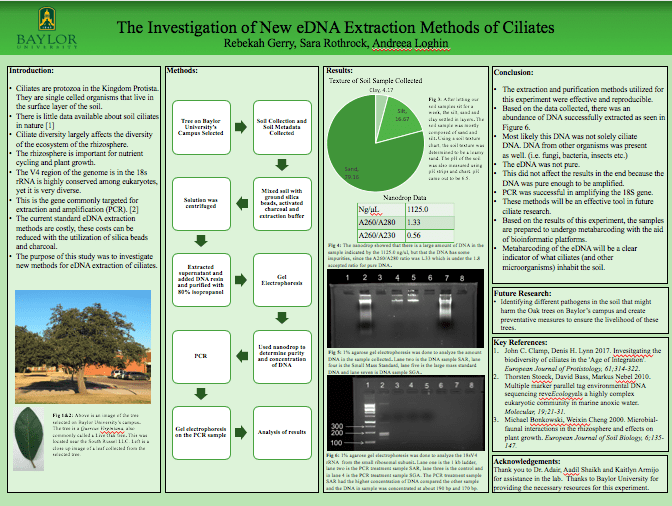
Ciliates are protozoa in the Kingdom Protista. They play many different roles within soil and aquatic ecosystems. There has been very little research done on ciliate behavior and interactions within the soil. Our study targeted ciliates within the rhizosphere. The rhizosphere plays a key role in the cycling of nutrients as well as plant growth. Ciliates shape the diversity of microorganisms within the rhizosphere, thus their presence is vital to a healthy ecosystem.
The purpose of this study was to investigate new methods for eDNA extraction of ciliates.
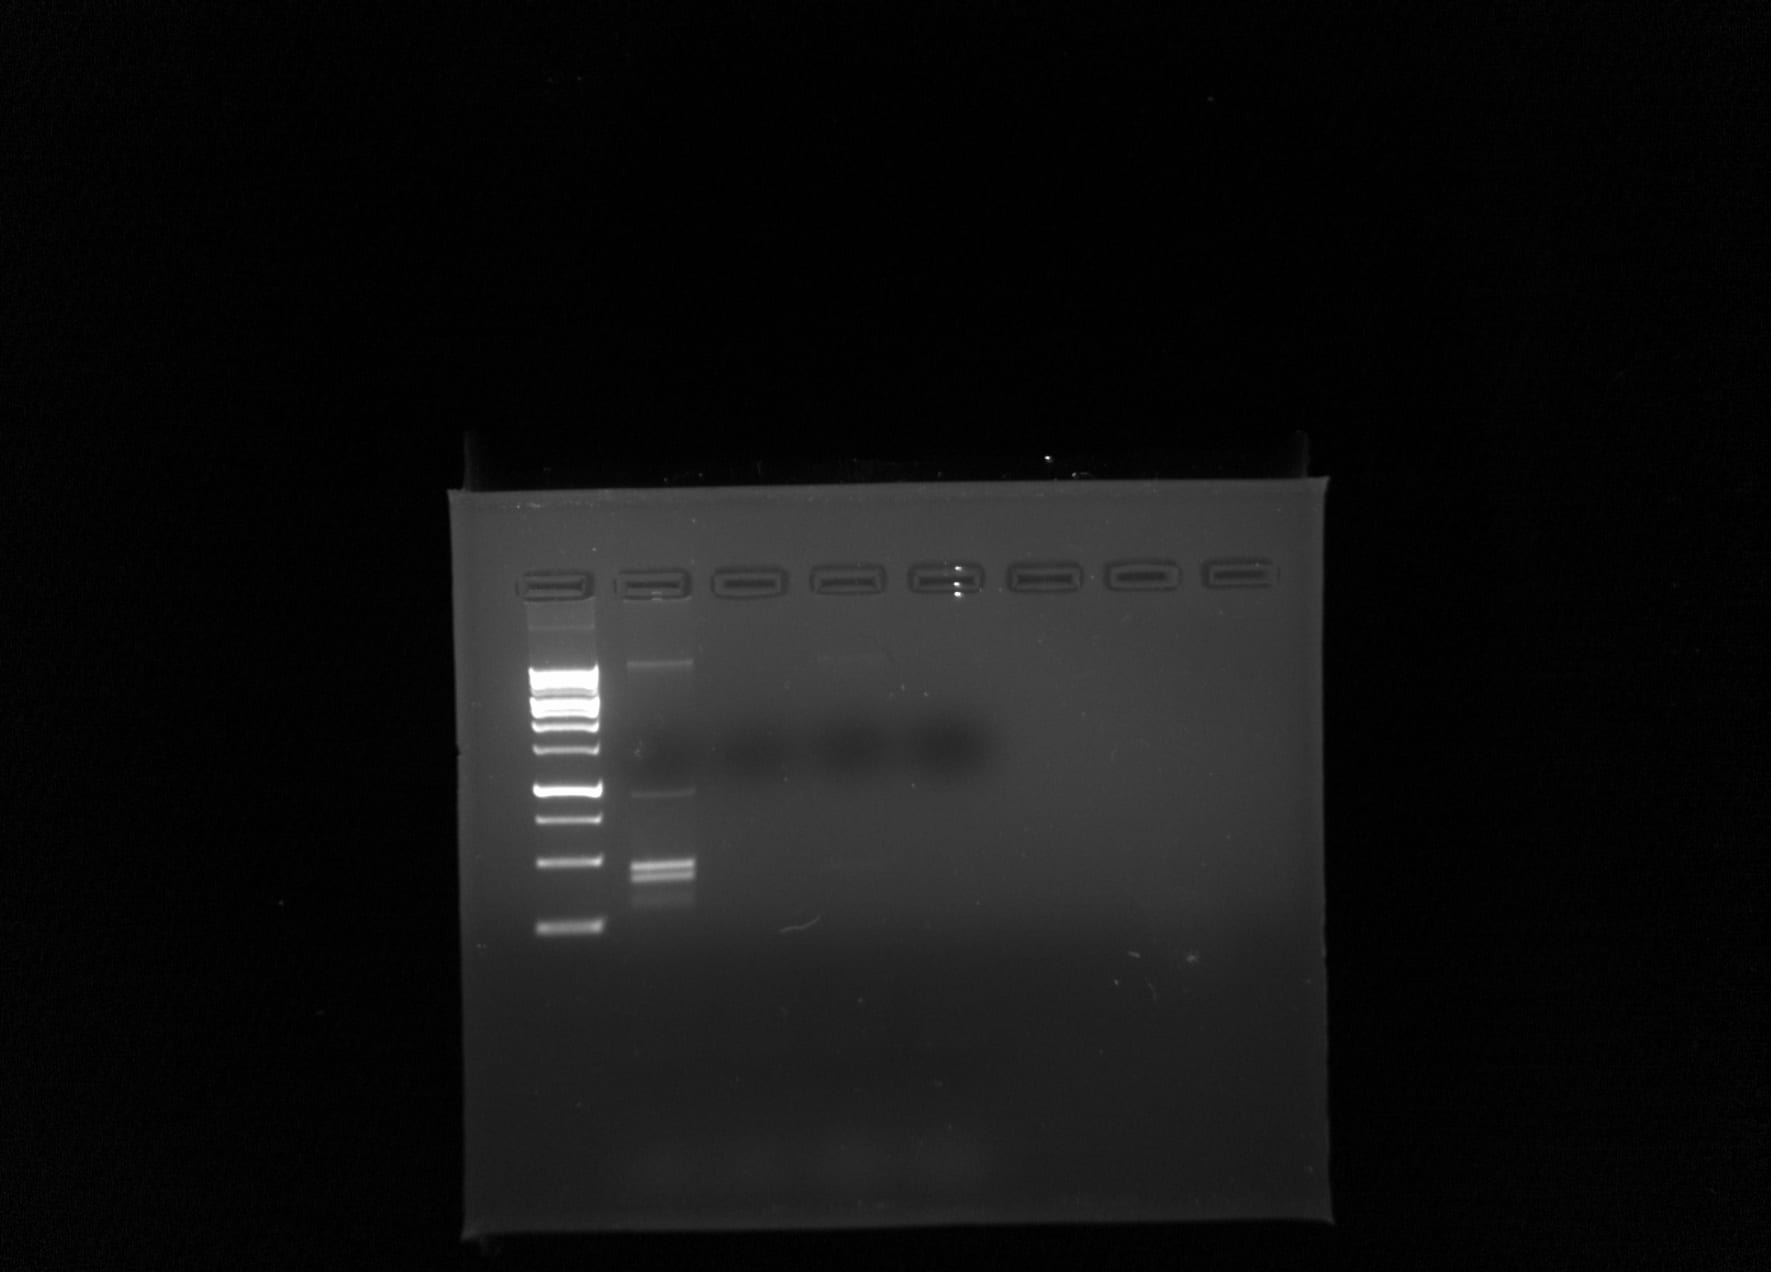
Creating this new method was achieved by researching different ways to extract eDNA. These different methods were then combined to maximize the amount of eDNA collected. Metadata was collected regarding the soil sample and the environment it was collected from. Gels were run to determine the amount of DNA collected. The samples that contained an abundance of DNA underwent PCR in order to amplify the strand so they could more easily be sequenced.
The samples were loamy sand, with a pH of 6.5. The concentration of DNA in the sample was 1125 ng/ul and the A260/A280 value was 1.33. The DNA sequenced not only belonged to ciliate species, but fungal and bacterial species as well.
These results gave reason to believe the use of charcoal and Silica beads was effective in the extraction of DNA.
Poster:
Conclusion:
This lab was extremely beneficial because I learned how to properly edit my poster to have all the information necessary about the research without too many words. My group was marked down mainly because the conclusion had to have more detail but edit out information that can be conveyed during the presentation and our introduction has irrelevant information to the specific research we did. After revising our poster, I feel confident in the poster we submitted and we were able to fix all the mistakes we had made.
Future Steps:
In the future, I hope to continue doing research and that my metadata is selected to be further sequenced because I think that it. would be really cool to see what is in my specific sample.