Lab 13: Ciliate Isolation and Characterization 11/15/2018

Objectives of this lab:
The objectives of this lab were to continue searching for soil ciliates as well as use the soil collected to find the soil texture percentages and what type of soil it is classified as.
Procedure:
- Using a ruler measure the amount of sand slit and clay in the test tube.
- Use the total measurement of soil to find the percentage of sand slit and clay by using this equation:
measurement of sand, slit or clay (cm)/total measurement of soil (cm) x 100
3. Continue looking for soil ciliates using soil from non-flooded plate and a compound microscope.
4. Drop 4, 5 microliters of soil onto glass slide and look through compound microscope at 4x and 10x.
Observations:
For the soil texture my soil measured in total 2 cm. It contained 40% sand ( .7 cm), 20% slit (.5cm) and 20% clay (.5cm). Using a soil texture calculator it was found that the soil was classified as “loam”.
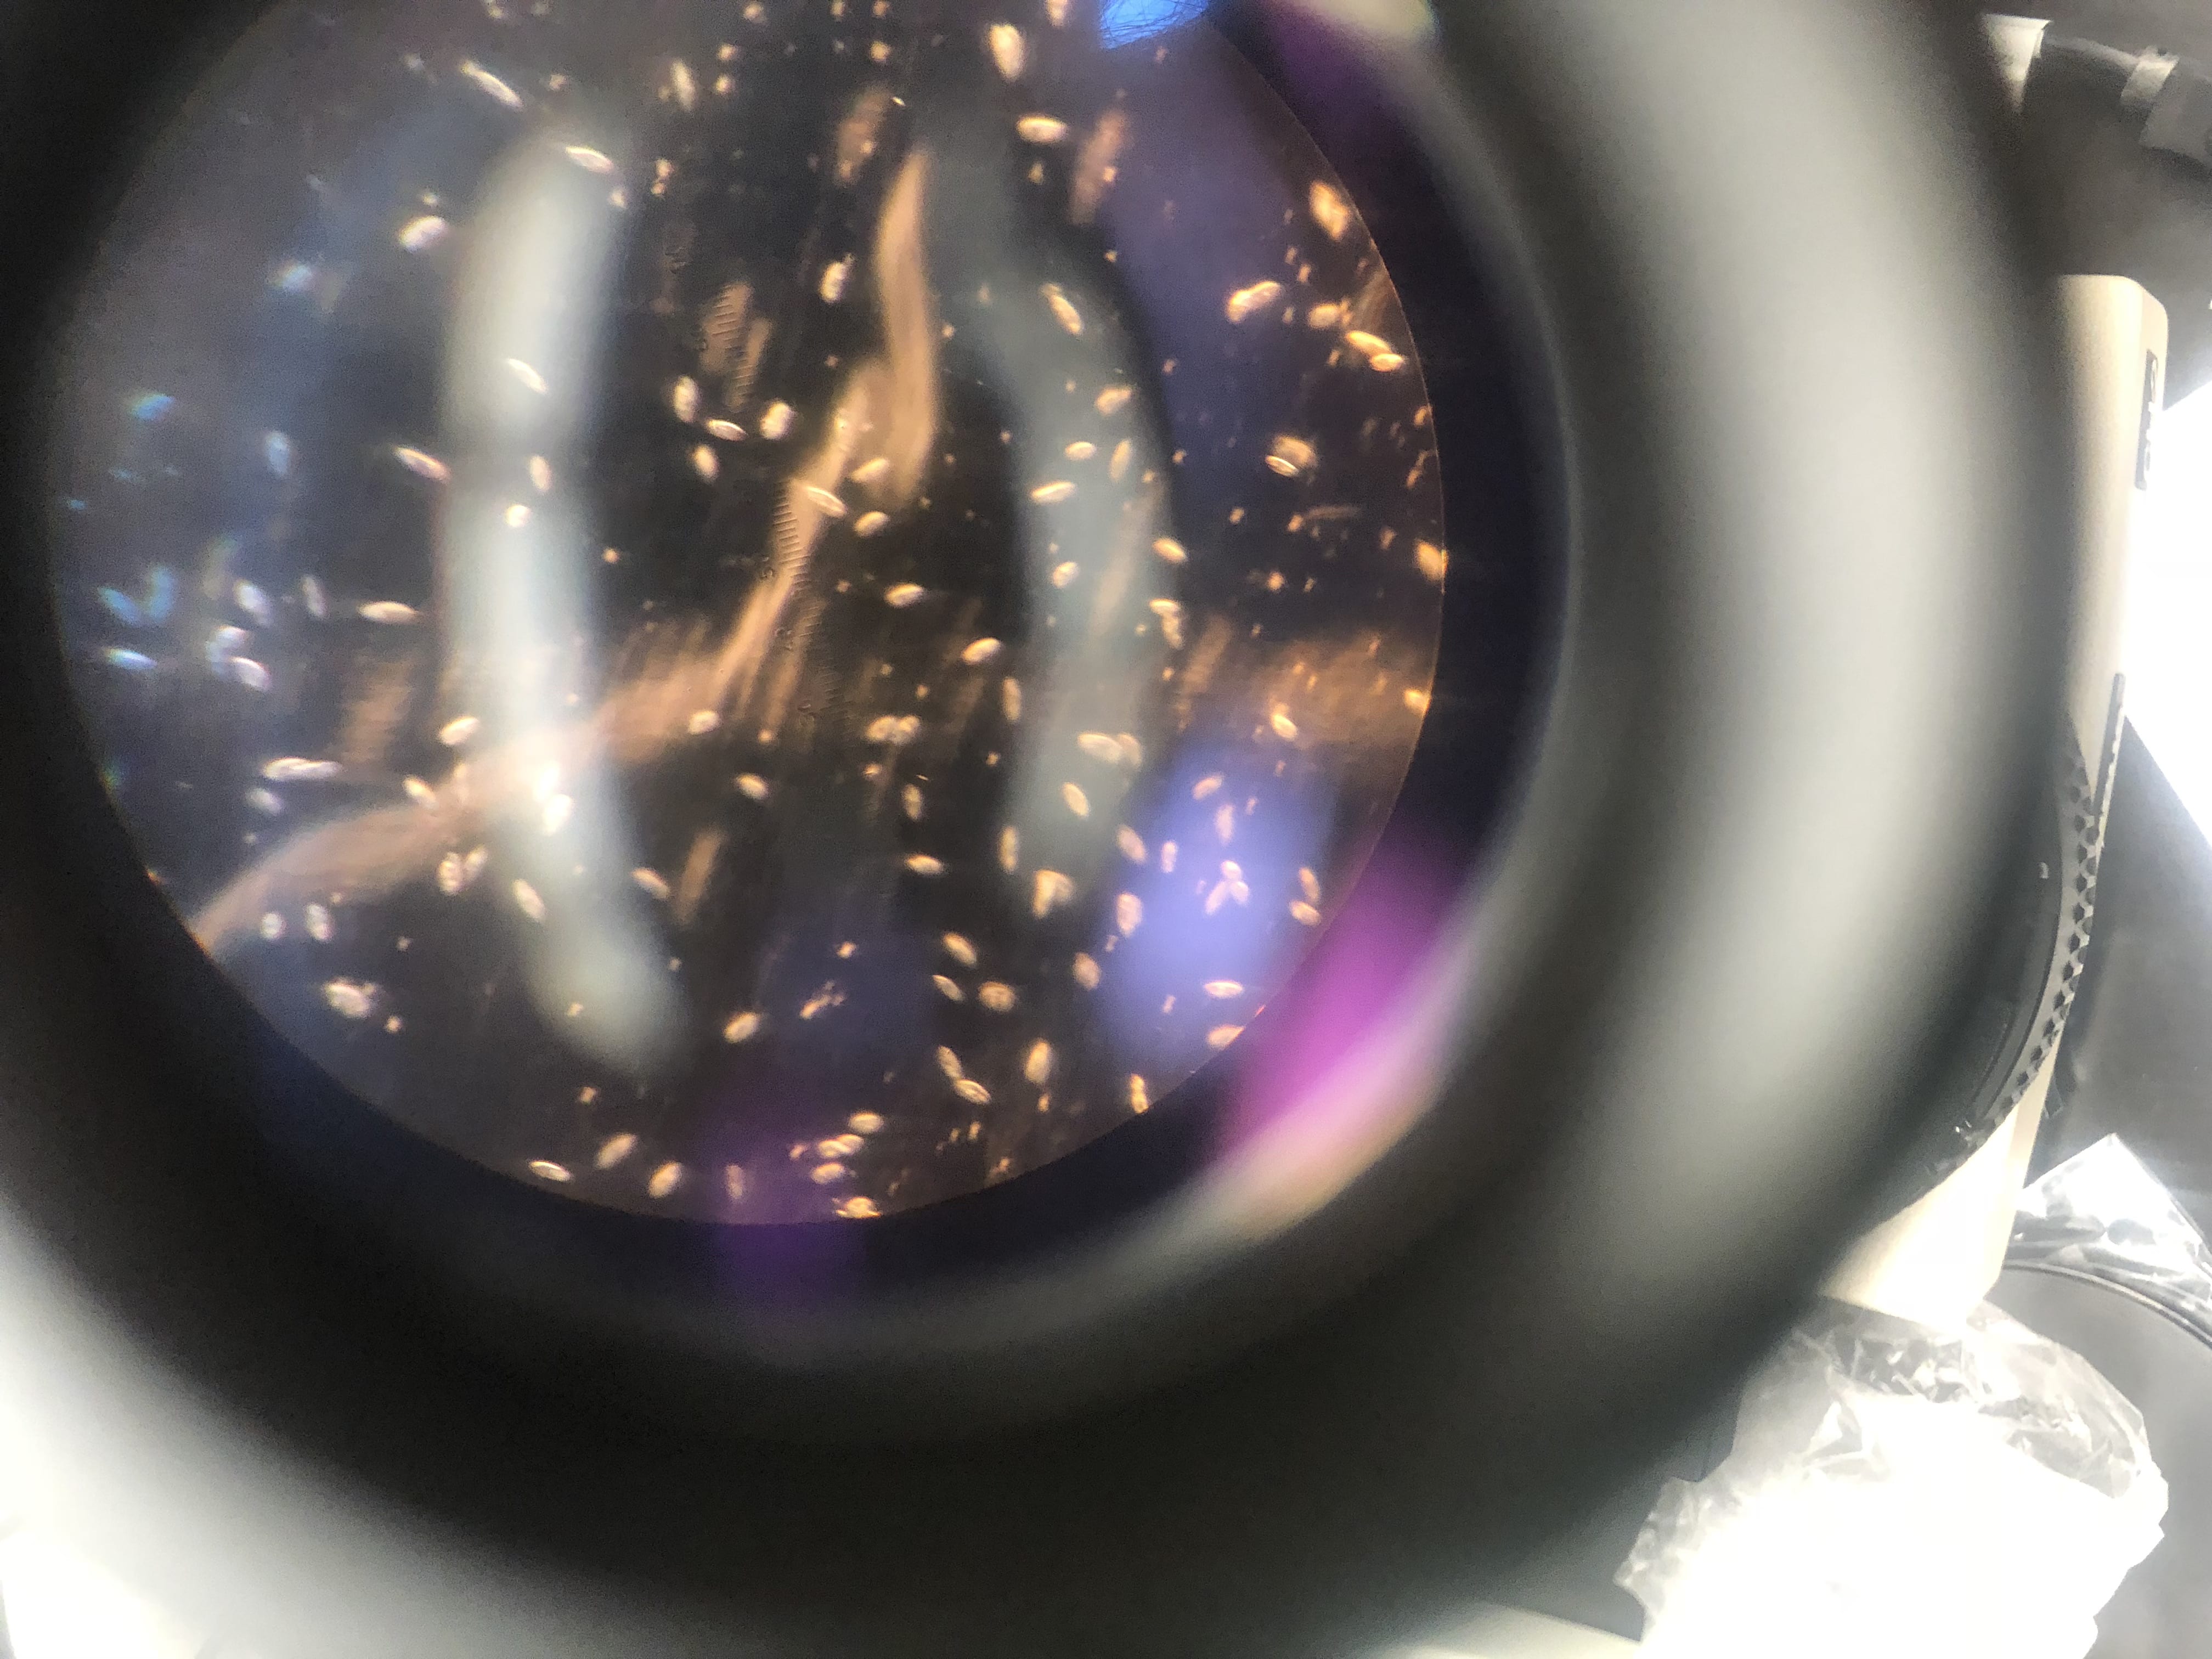
Using my soil I found one ciliate. I used methyl cellulose to slow it down, however it was very fast and very small and I eventually lost sight of it. My group mate found a ciliate using the soil form Bermuda grass provided to use by the lab.
In Future Labs:
Going forward the ciliate and soil texture found will be used for the final lab presentation as Lab 13 was our last actual lab.
Storage:
Glass slides were washed off, micropipettes were put back up and the soil was stored in the plastic bin.


 This was the diluted 10^-2 I used.