April 26

Lab 14: Poster Edits and Abstract 04/25/19

Print Friendly, PDF & Email

Purpose: 

The purpose of this lab was to prepare for our poster presentations by making edits based on comments/critiques made. Another focus was to make a final draft for an abstract that will be submitted for the CURE symposium. We organized all the information (meta-data) from our samples in order to analyze our samples after they have been sequences.

Procedure: 

  1. Vote on CILICURE logo, and what to do with it
  2. Organize metadata into excel sheet
  3. Make edits to poster and submit for printing, upload to box file
  4. Collaborate with team members to make a final abstract that will be submitted

Excel Metadata: 

section group label GPS location species BHD pH Soil texture Extraction DNA concentration
25 4 GRS25_2Sp19 -97.1182, 31.5498 Quercus virginiana 57cm 6.4 clay loam silica bead 262.1
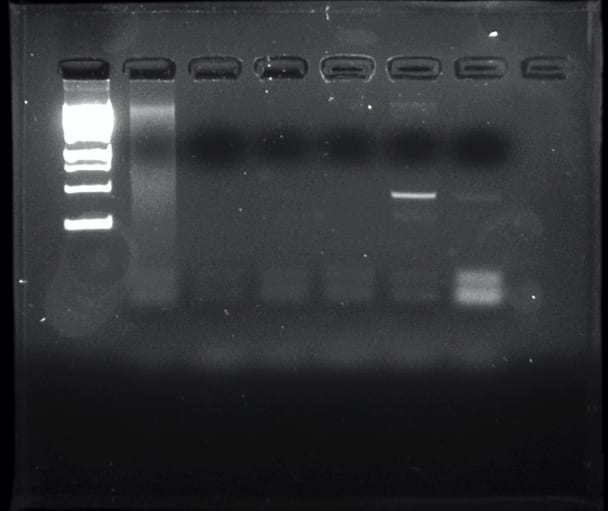
  • The PCR result was also negative

Poster: 

Abstract: 

Title:

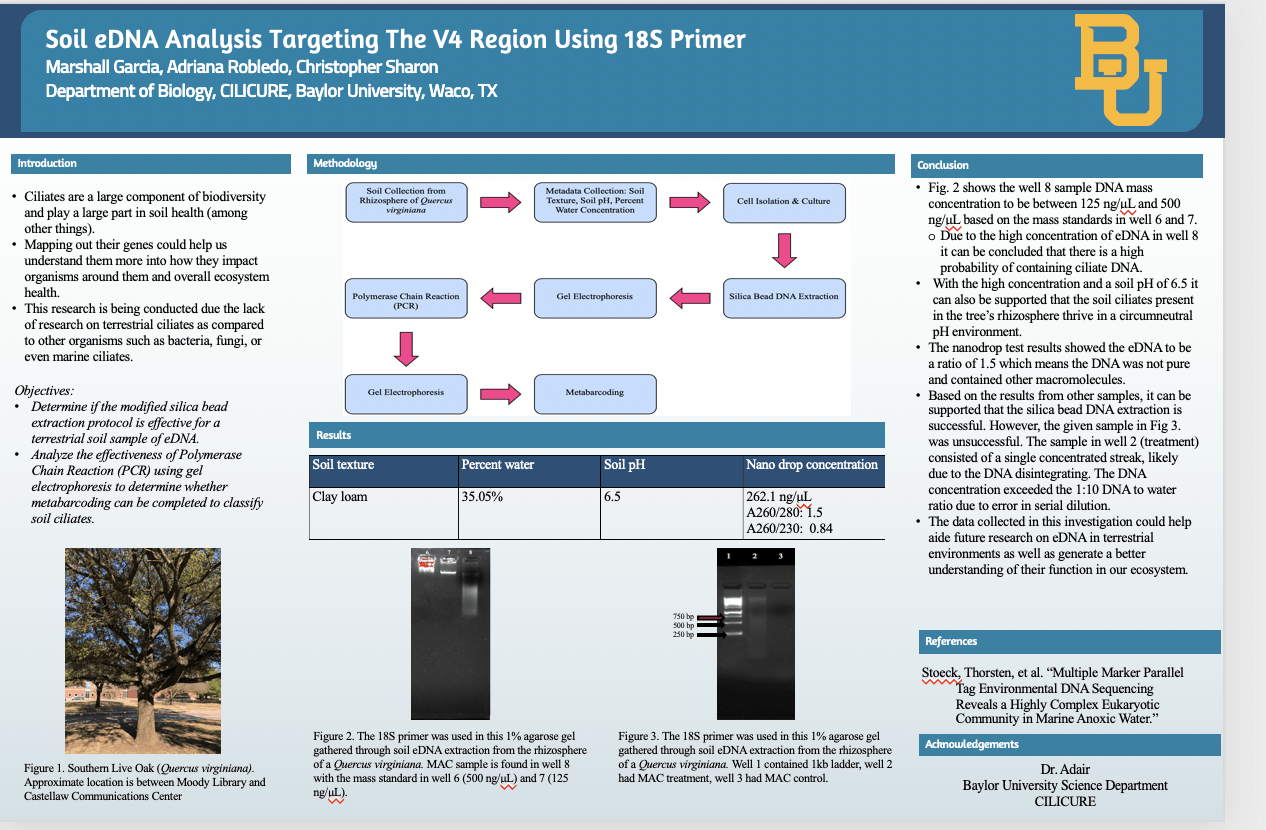
Soil eDNA Analysis Targeting the V4 Region Using the 18S Primer

Abstract

Soil ciliates are a diverse group of eukaryotes that play an important role in the environment but are understudied due to a lack of standard methods used to extract them from soil. The purpose of this experiment was to determine ciliate biodiversity in soil samples taken from the rhizosphere of Baylor trees. The protocols used were ones that have yet to be perfected in hopes of establishing them as universal method such as silica bead extraction of DNA and the chelex extraction method. DNA was extracted and purified from the soil collected using the ‘silica bead method’. The DNA concentration was obtained using a nanodrop and gel electrophoresis by running against a mass standard, and used PCR to amplify the 18s V4 region. The Polymerase Chain Reaction yielded a negative result, indicated by a ‘smear’ of DNA rather than a band. The nanodrop showed the concentration of DNA to be 262.1 ng/µl with the A260/280 to be 1.5. Despite negative results, the experiment showed the validity of results that can be found through silica bead and chelex DNA extraction; however, the lack of positive results was most likely due to an improper dilution or a degradation of DNA. Additionally, further research can be done using bioinformatics to visualize the ciliate diversity.

Word Count: 215

Discussion/Future Goals: 

After working through edits for the poster I am becoming more excited to share our research with others. We will continue to practice presentations to the class next week before our presentation at the CURE symposium. Hopefully soon we send our DNA off for Illumina Sequencing and analyze it using QIIME2 and Cyverse. We will be able to use these programs in order to determine the biodiversity of the organisms, and hopefully ciliates, on our soil sample that was collected at the beginning of the semester.


April 19

Lab 13: Soil eDNA Metabardocing Analysis, Qiime2 04/18/19

Print Friendly, PDF & Email

Purpose: 

The purpose of this weeks lab was to apply our knowledge from the previous weeks about how to use the terminal and Qiime2 program on previously collected DNA samples collected in last years CILICURE lab.

Procedure: 

  1. Install miniconda environment on Mac, open the terminal (conda update conda to check)
  2. Download file in BOX folder titled CILICURE_2018
  3. Open the word file and follow the steps of commands to enter into the terminal

Importing Sequences as QIIME2 Artifact:

qiime tools import \

–type EMPPairedEndSequences \

–input-path emp-paired-end-sequences \

–output-path emp-paired-end-sequences.qza

Demultiplexing

qiime demux emp-paired \

–m-barcodes-file sample-metadata.tsv \

–m-barcodes-column BarcodeSequence \

–i-seqs emp-paired-end-sequences.qza \

–o-per-sample-sequences demux.qza \


qiime demux summarize \

–i-data demux.qza \

–o-visualization demux.qzv

Denoising using DADA2/feature tables

qiime dada2 denoise-paired \

–i-demultiplexed-seqs demux.qza \

–p-trunc-len-f 220 \

–p-trunc-len-r 220 \

–o-table table.qza \

–o-representative-sequences rep-seqs.qza \

–o-denoising-stats denoising-stats.qza


qiime feature-table summarize \

–i-table table.qza \

–o-visualization table.qzv \

–m-sample-metadata-file sample-metadata.tsv


qiime feature-table tabulate-seqs \

–i-data rep-seqs.qza \

–o-visualization rep-seqs.qzv


qiime metadata tabulate \

–m-input-file denoising-stats.qza \

–o-visualization denoising-stats.qzv

Phylogenetic Tree

qiime phylogeny align-to-tree-mafft-fasttree \

–i-sequences rep-seqs.qza \

–o-alignment aligned-rep-seqs.qza \

–o-masked-alignment masked-aligned-rep-seqs.qza \

–o-tree unrooted-tree.qza \

–o-rooted-tree rooted-tree.qza

Taxonomic Classification

qiime feature-classifier classify-sklearn –i-classifier silva-132-99-515-806-nb-classifier.qza –i-reads rep-seqs.qza –o-classification taxonomy.qza


qiime metadata tabulate \

–m-input-file taxonomy.qza \

–o-visualization taxonomy.qzv


qiime taxa barplot \

–i-table table.qza \

–i-taxonomy taxonomy.qza \

–m-metadata-file sample-metadata.tsv \

–o-visualization taxa-bar-plots.qzv

  • Use QIIME2 view, take the .qzv files and drag them into the labeled box to get a representation of the data.

Conclusion: 

Using QIIME2 we were able to effectively analyze the biodiversity of not just ciliates, but of all organisms present in the sample. The sequence of DNA was blasted (the sequence was compared to every sequence available in the NCBI database. This can be used used in the future on our own DNA samples in order to analyze the many microorganisms present in the soil sample collected from the Baylor trees.

Future Goals: 

I want to continue to improve with using this program to make the process of getting started each class much faster so we don’t waste more time than we need. Our specific DNA samples won’t be sequences till the semester is over so hopefully we can analyze the samples on our own time in the fall and potentially continue the research.


April 12

Lab 12: Moving Pictures Tutorial 04/11/19

Print Friendly, PDF & Email

Purpose: 

The purpose of this weeks lab was to expand on knowledge learned in the previous week about the terminal, and apply it by using the moving pictures tutorial in order to receive visualizations of the data/ commands we are inputting into the terminal.

Procedure:

  1. Make sure that Miniconda, conda, qiime 2 are installed on the computer/terminal – conda update conda, source activate qiime2-2019.1
  2. Make directory qiime2-moving-pictures-tutorial by using the mkdir command, then change to that directory by using cd command.
  3. Get sample metadata from the qiime website
    1. wget \
      -O “sample-metadata.tsv” \
      “https://data.qiime2.org/2019.1/tutorials/moving-pictures/sample_metadata.tsv”
  4. Make new directory titled amp-single-end-sequences
  5. Use wget for sample barcodes and sequences
    1. wget \
      -O “emp-single-end-sequences/barcodes.fastq.gz” \
      “https://data.qiime2.org/2019.1/tutorials/moving-pictures/emp-single-end-sequences/barcodes.fastq.gz”
    2. wget \
      -O “emp-single-end-sequences/sequences.fastq.gz” \
      “https://data.qiime2.org/2019.1/tutorials/moving-pictures/emp-single-end-sequences/sequences.fastq.gz”
  6. Import amp-single-end-sequences, create .qza file
    1. qiime tools import \
      –type EMPSingleEndSequences \
      –input-path emp-single-end-sequences \
      –output-path emp-single-end-sequences.qza
  7. Demultiplex sequences, summarize (qza format)
    1. qiime demux emp-single \
      –i-seqs emp-single-end-sequences.qza \
      –m-barcodes-file sample-metadata.tsv \
      –m-barcodes-column BarcodeSequence \
      –o-per-sample-sequences demux.qza
    2. qiime demux summarize \
      –i-data demux.qza \
      –o-visualization demux.qzv
  8. Using qiime tools view, input the demux.qzv file.
  9. Denoise
    1. qiime dada2 denoise-single \
      –i-demultiplexed-seqs demux.qza \
      –p-trim-left 0 \
      –p-trunc-len 120 \
      –o-representative-sequences rep-seqs-dada2.qza \
      –o-table table-dada2.qza \
      –o-denoising-stats stats-dada2.qza
  10. Tabulate
    1. qiime metadata tabulate \
      –m-input-file stats-dada2.qza \
      –o-visualization stats-dada2.qzv
  11. Move dada2 file and table
    1. mv rep-seqs-dada2.qza rep-seqs.qza
      mv table-dada2.qza table.qza
  12. Create feature table using table.qza file and rep-seqs.qza file
    1. qiime feature-table summarize \
      –i-table table.qza \
      –o-visualization table.qzv \
      –m-sample-metadata-file sample-metadata.tsv
      qiime feature-table tabulate-seqs \
      –i-data rep-seqs.qza \
      –o-visualization rep-seqs.qzv
  13. Use wget to get taxonomic classifier
    1. wget \
      -O “gg-13-8-99-515-806-nb-classifier.qza” \
      “https://data.qiime2.org/2019.1/common/gg-13-8-99-515-806-nb-classifier.qza”
    2. qiime feature-classifier classify-sklearn \
      –i-classifier gg-13-8-99-515-806-nb-classifier.qza \
      –i-reads rep-seqs.qza \
      –o-classification taxonomy.qza
    3. qiime metadata tabulate \
      –m-input-file taxonomy.qza \
      –o-visualization taxonomy.qzv
  14. Create barplot
    1. qiime taxa barplot \
      –i-table table.qza \
      –i-taxonomy taxonomy.qza \
      –m-metadata-file sample-metadata.tsv \
      –o-visualization taxa-bar-plots.qzv


Results: 

Sample ID Barcode Sequence Primer Sequence Location of Soil Sample Month Year Soil Texture Soil pH Percent Water Content Nanodrop Read Extraction type Tree Diameter
AMC (group initials) Moody Library/Castellaw Communications January 2019 Clay Loam 6.7 6.98% 1.57 Silica bead  

Conclusion: 

Upon completion of the lab, I learned how to create visual representations of the data using Qiime 2. We will be able to apply this program to our own experimental data in order to analyze the biodiversity of our own samples, and then make deeper comparisons using different criteria listed in the table.

Future Goals 

We will continue to develop a protocol for analyzing our DNA sequence for using the Qiime 2 software and hopefully getting meaningful results. I will continue to improve in efficiency with the program

April 5

Lab 11 URSA Presentations and Cloud Computing

Print Friendly, PDF & Email

Purpose: 

The purpose of this lab was to discuss the posters seen during URSA scholars week and become familiar with using the Mac console terminal. Qiime 2 was downloaded and important terms were learned that are necessary for moving forward.

Procedure:

  1. Discuss URSA posters
  2. Qiime 2 presentation
  3. Introduction to Terminal
  4. Learn important commands in Terminal
    1. “conda update conda” “conda install wget”, etc.
  5. Download Qiime 2/ miniconda
  6. Work through the online tutorial and record information learned.
  7. When done with QTM log of computers and turn in assignment.

Results: 

No data was collected

Conclusion: 

We were able to successfully install Qiime 2 onto our personal Macs if we had them. It was necessary to use Apple computers as they can run Linux software required for the Qiime 2 program. The QTM gave us a general overview into terms we need to know moving forward and the type of graphics we will interpret. Its necessary that everyone has a basic understanding of the system so we can move forward with the bioinformatic section of our research. We are still awaiting access to the atmosphere program so we can begin metagenomic analysis of our sample.

Future Goals: 

It is important we as a class become proficient in using the Terminal on an Apple computer so we can keep moving forward in our research. Hopefully when results are processed we can analyze biodiversity (mainly ciliates) of our trees at Baylor.


March 29

Lab 10 Next Generation Illumina Sequencing/ Metabarcoding 03/29/19

Print Friendly, PDF & Email

Purpose: 

This weeks lab was designed to introduce us to CyVerse and Illumina sequencing technique. We discussed the order of the steps using a card game. We also finished setting up our CyVerse accounts.

Procedure: 

Organize a set of cards in the proper order using previous knowledge and the Minilecture 19 PowerPoint.

Sequencing Steps: 

  1. Break up DNA in fragments (around 200-600 bp)
  2. Tag DNA fragments with adaptors
  3. Denature double stranded molecules into single stranded that have adaptor and primer binding site. This is done using sodium hydroxide and incubation.
  4. Attach DNA fragments to flow cell through complimentary biding of adaptors to primers on surface of the flow cell
  5. Replicate DNA attached to lyocell to form small DNA clusters with the same sequence.
  6. Unlabeled nucleotide and DNA polymerase are then added to lengthen and join strands of DNA attached to flow cell. This creates ‘bridges’ of double-stranded DNA between primers on flow cell surface.
  7. Double stranded DNA is broken down into single stranded DNA using heat, leaving several million desserts clusters of identical DNA sequences.
  8. Primers and fluorescnetly labeled terminators are added to the flow cell.
  9. Primer attaches to DNA being sequences.
  10. DNA polymerase then binds to primer and adds first fluorescent labeled terminator to new DNA strand. Once a base has been added no more bases can be added to the strand of DNA until the terminator base is cut from the DNA.
  11. Lasers passed over flow cell to activate fluorescent label on nucleotide base. Fluorescence is detected by a camera and recorded on a computer. Each of terminator bases give off a different color.
  12. The fluroescently labeled terminator group can be added alongside. And so, the process continues until millions of clusters have been sequenced.

Conclusion and Future Steps: 

This weeks lab we looked at new sequencing techniques that we will apply to analyze our DNA. Using the card game helped to understand the fundamentals of the steps in order to better understand what we are doing moving forward in the weeks ahead. We did an overview of how CyVerse worked so we can understand how we have access to multiple sets of data. We will use Illumina sequencing on our DNA samples and utilize CyVerse to analyze the results.

March 22

Rough Draft Poster Presentations Lab 9 03/21/19

Print Friendly, PDF & Email

Purpose:

The purpose of this weeks lab was to present the rough draft of our group posters that we have been working on. We would then receive feedback from the class after about what we can improve on.

Feedback:

Following our presentation we discussed a variety of things that we can improve on. Some major points were to make the fonts sizes all the same (24) to keep consistency throughout. The font size also needs to be large enough for the audience to be able to view it from a few feet away. Our group was also told to remove a picture of the nanodrop and just include a data table instead. We also need to rearrange our pictures to follow a flow of the procedure so nothing is out of order. Our outline and methodology section was also too similar so we can probably just combine the two. Our results and conclusion section need to be more fleshed out to include metadata and more implications of the research we are doing. The resources also need to be reformatted into APA format.

Conclusion/Future Steps: 

We will continue to work on the poster presentation taking into account all the critiques in order to turn in the final poster next week. We will continue expanding on metagenomics and getting more into sequencing the data using online databases. The poster will be presented at the CURE symposium at the end of the semester, concluding our ciliate research the past two semesters.

March 8

Lab 8: PCR and Scientific Poster Design

Print Friendly, PDF & Email

Purpose: 

This weeks lab objective was to run the amplified DNA samples that was obtained from PCR and perform gel electrophoresis. We then determined if there was analyzable DNA present from the eDNA soil sample. We also began the rough draft for the scientific poster to start organizing all of the data collected into a concise and cohesive poster presentation.

Procedure: 

  1. Put on proper PPE (gloves) and obtain remade 1.5% agarose gel from the refrigerator.
  2. Map out the gel and label which sample is going in the wells.
  3. Obtain amplified DNA sample, and place the gel (remove rubber molds and comb) into the gel box. Fill the box with 1X TAE Buffer solution until the wells are covered completely.
  4. Fill obtain Kb ladder and transfer 5 microliters to the first well with micropipette.  Fill the other wells the the control and sample with 10 microliters each.
  5. Obtain voltage box and plug in correctly. Turn the machine on and run the gel at 100 volts for 25-30 minutes.
  6. Clean up area and dispose of any waste materials that can not be reused.

Results: 

Conclusion: 

Our sample and control was in lanes 2 and 3 respectively (left to right). The presence of the long band could be due to error in not diluting the DNA properly as there should be distinct bands like in the other wells. The two bands towards the bottom the gels are most likely bound primers. However the DNA bands that are in lanes 6 and 7 are also soil eDNA so further analysis can still be done.

Future Goals: 

It is unfortunate that the DNA bands did not show up properly in our wells most likely due to error however that does not mean all the results collected are meaningless. There is still metadata collected in the earlier weeks that we can analyze to determine the overall health of the tree and towards the end of the semester will be able to compare changes. We will combine all the results and conclusions made so far and add them to the research poster rough draft.

March 1

Lab 7: PCR Amplification of DNA 02/28/19

Print Friendly, PDF & Email

Purpose: 

The goal for this week of lab was to investigate into PCR, or polymerase chain reaction. We learned about how it works and the different uses for it. We learned this by completed the set up for a PCR reaction of our eDNA of soil collected on Baylor University, by Moody library and Castellaw Communications. We also began preparation for our scientific poster planning out the layout and general content to be displayed.

Procedure: 

Work Space Set Up

  1. Clean designated area with 10% bleach with paper towel or other material to wipe down table.
  2. Obtain gloves for proper PPE and to protect the materials being used from contamination.
  3. Clean and wipe down the pipettes with 10% bleach before working with the DNA.
    1. Obtain autoclaved tubes and filter tips.
    2. When not in use, make sure all pipette tip boxes and tubes are closed to prevent contamination.
  4. If possible try to minimize unnecessary movement and airflow around work space to prevent contamination.

PCR Reaction Set Up

  1. Obtain two micro centrifuge tubes, one for the control and one for treatment, with 12.5 microliter of Master mix and 1 microliter of primers already prepared in   the tube.
  2. The maximum amount of DNA that can be added is 5 microliter, therefore use the data of DNA concentration obtained from the nano drop during last weeks lab and use that data to calculate a dilution.
  3. Once the proper amount has been calculated (make sure that the total volume equals exactly 25 microliters). Add the amount to the tube containing the Taq polymerase mix.
  4. Add the given amount of water from the table provided to the control tube. Centrifuge both the control and treatment.
  5. Label the control and treatment group with initials. Place them in the thermal cycler rack and record the exact spot using the grid lines provided (row and column).
  6. Clean off workspace and make sure everything is clean before leaving lab.

Results: 

Tube 1 (Euk V4) 3 (Control Euk V4)
2x Taq Mix (microliter) 12.5 12.5
DNA (microliter) 3.8 0
10 Micromolar Euk Primers (microliter) 1 1
Water (microliter) 7.7 11.5
Total Volume (microliter) 25 25

Concentration of DNA: 262.1 ng/μL

Dilution: 1:10

Calculations:

262.1/10=26.2

100/26.2=3.81 microliters

Conclusion: 

Our group calculated the dilutions necessary to keep a 1:10 ratio for the DNA for PCR. We isolated the variable V4 of the DNA by utilizing the primer 18sV4, this was the treatment group. The master mix used was added to elongate the DNA sample for amplification. Through amplification we will be able to have a more complete analysis when the DNA is sequenced and when we perform gel electrophoresis. After the initial set up of PCR the samples will be placed in a thermal cycler where the treatment and control groups will denature, anneal (primers attach), and then elongate at start of primer. The Taq polymerase was crucial as it is able to stay stable in the temperatures of the thermal cycler.

Next Step:

Once PCR is complete the next step is to send the sample off for sequencing so we can perform gel electrophoresis. We mainly focused starting to prepare our scientific poster for presentation in the coming weeks. We discussed with our the groups the general design and information that is to be included on the poster so that is is concise and easy to read for the audience to get the big picture of why this research is being conducted. The focus of next lab meeting will be to analyze the PCR results and start working on the scientific poster design in greater detail.

February 22

Lab 6: Gel Electrophoresis and DNA Analysis 02/21/19

Print Friendly, PDF & Email

Purpose: 

The purpose leading up to the lab was to write the methods section for all the procedures completed since week 1. In lab the purpose was to make perform gel electrophoresis and perform a series of analysis tests including nanodrop and observing the gels under ultraviolet light. This will all sum to drafting a protocol article.

Methods: 

Setting up the Agarose Gel

  1. Obtain the gel from the refrigerator stored in in from the previous week.
  2. Place the gel in the gel box and orientate the gel so that the wells are furthest from the positive electrode (this is because DNA is negative and will therefore be attracted to the positive electrode and move through the gel).
  3. The volume of the DNA that is loaded into the gel is dependent upon the type of samples being analyzed. Each one of the wells can hold up to 10 microliters.
    1. In some cases the sample will be diluted to 10 microliters with loading buffer or dye and water.
  4. Pour deionized water into the gel box until it is slightly higher than the top of the gel

Determining DNA Concentration

  1. Mix two microliters of DNA with landing buffer and water to make a total of ten microliters.
  2. Calculate the total amount of loading buffer needed based on concentration
  3. Load the ten microliter in a well on the gel. Load at least two DNA Mass standards to determine the approximate concentration, one high and one low (500/125)

Running the Agarose Gel

  1. Once the gel has been loaded with the appropriate DNA and mass standards, assemble the gel box making sure the electrodes are oriented correctly.
  2. Turn on the voltage/gel machine and set to 100 V for 20-30 minutes.

Analyzing the Gel

  1. Place the gel under ultraviolet light in a dark room and take a picture of the results.
    1. Make sure to wear proper PPE (glasses) in order to protect eyes from UV light.

Nanodrop

  1. Clean the surface of the nanodrop apparatus with DIH2O
  2. Add single fro of DNA sample to the machine
  3. Close the lid and run the test
  4. Record the data and the graph shown. on the screen

Data/Observations: 

Observations

The soil DNA showed prominent bands and a soil had concentration roughly under 500 and above 125. The ration for the nano drop was around the normal 1.8.

Storage

The gels were brought back to the lab room and disposed of properly, the DIH2O was emptied from the gel box

Future Goals: 

I think it is interesting that for my section the Chelex protocol was not as successful as the soil DNA silica beads protocol. This may have been due to errors during DNA extraction but unless the DNA is find a new protocol. analyses again there is no way to determine if this was the case. Next time we perform gel electrophoresis and DNA extraction we need to take accusation we follow the procedures exactly the same way as written or possibly determine. I am also curious as to how we are going to determine a standard ladder for the soil DNA.

February 15

Lab 5: DNA Analysis and Purification 02/14/19

Print Friendly, PDF & Email

Purpose: 

The purpose of this lab meeting was to purify the DNA extracted and make agarose gels for gel electrophoresis. This was done in order to prepare for DNA analysis using the gels to determine a possible match of DNA in the soil when comparing the standard ladder.

Procedure: 

DNA Purification: 

  1. Before beginning make sure to obtain the proper PPE, since the lab deals with potentially harmful chemicals gloves should be worn at all times.
  2. Use a microfuge tube with the crude soil and fill with sterile water until the 1 mL mark is reached.
  3. Transfer solution to a 15 mL tube that can be used for mixing.
  4. Add 2 mLs of warm DNA resin from the kit, this should be at 37ºC and mix by inversion several times before pipetting 2 mL to tube.
  5. Set up column on syringe barrel, and set on vacuum filtration manifold.
  6. Add roughly half of the resin to the column and urn on the vacuum. When the liquid is pulled through add the remainder of your sample.
  7. Was column by adding 2 mL of 80% isopropanol and using the vacuum to pull through. Begin by adding small amount and allowing to flow before adding more.
    1. Repeat twice more for a total of three washes.
  8. Remove column from barrel and put column in clean 1.5 mL tube. Spin at 8000 x g for 5 minutes in centrifuge to remove residual isopropanol.
  9. Take column out of 1.5 mL tubes and put in 80ºC+ heat block for about thirty seconds to one minute.
  10. Place column in new 1.5 mL tubes and apply 50 microliters of diH2O heated to 80ºc directly to column.
  11. Incubate for one minute
  12. Spin at 8000 x g for one minute

Making Agarose Gel

  1. Transfer 4 mL of 10x stock TAE to 36 mL of diH2O in vile.
  2. Add 0.4 g of agar powder to a 125 mL Erlenmeyer flask, add the TAE solution to the flask.
  3. Place flask in microwave for one minute, once done mix the solution by swirling the flask.
  4. Add 2 microliters of ethidium bromide to the flask.
  5. Transfer the solution in the flask to to gel cast and let solidify (30 minutes).
  6. Pour 1x TAE on top of the solidified gel until the cast is full.
  7. Obtain a plastic bag (ziploc) and store in refrigerator at 4ºC for one week.

Data: 

No observations or data was recorded.

Conclusion: 

In this lab we purified the DNA to prepare it for gel electrophoresis.

Future Goals: 

I want to expand my knowledge on the processes and how everything actually works instead of just mixing a bunch of different chemicals together. Next lab meeting hopefully the gels will show successful results.