April 26

Lab 14: Poster Presentation and Abstract Submission

Print Friendly, PDF & Email

Daphne Simo

04/26/19

I. TITLE

Poster Presentation and Abstract Submission

II. RATIONALE/PURPOSE

The purpose of this lab was to create a finalized version of of our abstract and scientific poster to present at the CURES in Bio Symposium next week. We also completed a spreadsheet that contained metadata for our selected soil samples used for extraction, purification, amplification of the environmental DNA.

III. MATERIALS

Computer

Poster

Abstract

IV. PROCEDURE

Metadata Collection and Soil Sample Labelling

  1. Label bag and eDNA with your Soil Sample ID.
  2. Complete the “Soil eDNA Metadata Spring 2019” spreadsheet with the soil sample ID,  pH, volume of DNA, PCR results, DNA concentration (ng/μl), Breast Heigh Diameter, GPS location, soil texture, and Genus species of the tree where the soil was collected.
  3. Complete questionnaire on QTM about t-shirt designs for Cili-CURE and availability to present at the symposium.

Abstract and Scientific Poster Editing

  1. Work with group members to edit and finalize abstract and scientific poster for submission.
  2. View feedback from Dr. Adair and the LA/TA to improve abstract and poster.
  3. Submit abstract and poster to Box and for Week 14 QTM.

V. DATA/OBSERVATIONS

Metadata

Group Members

Tyler Kingston, Daphne Simo, Johanna Warner

Section

21

Group Number

4

Soil ID

KSW21_4Sp19

GPS Location

-97.1146, 31.532

Tree Species

Quercus imbricaria

BHD (cm)

34

pH

6.5

Soil Texture

Clay Loam

Extraction Method

Silica Bead

DNA Concentration (ng/μl)

244

DNA Volume (μl)

15

PCR Results

+

Soil Label on Bag

KSW21SP19

Column

Title of Poster and Abstract

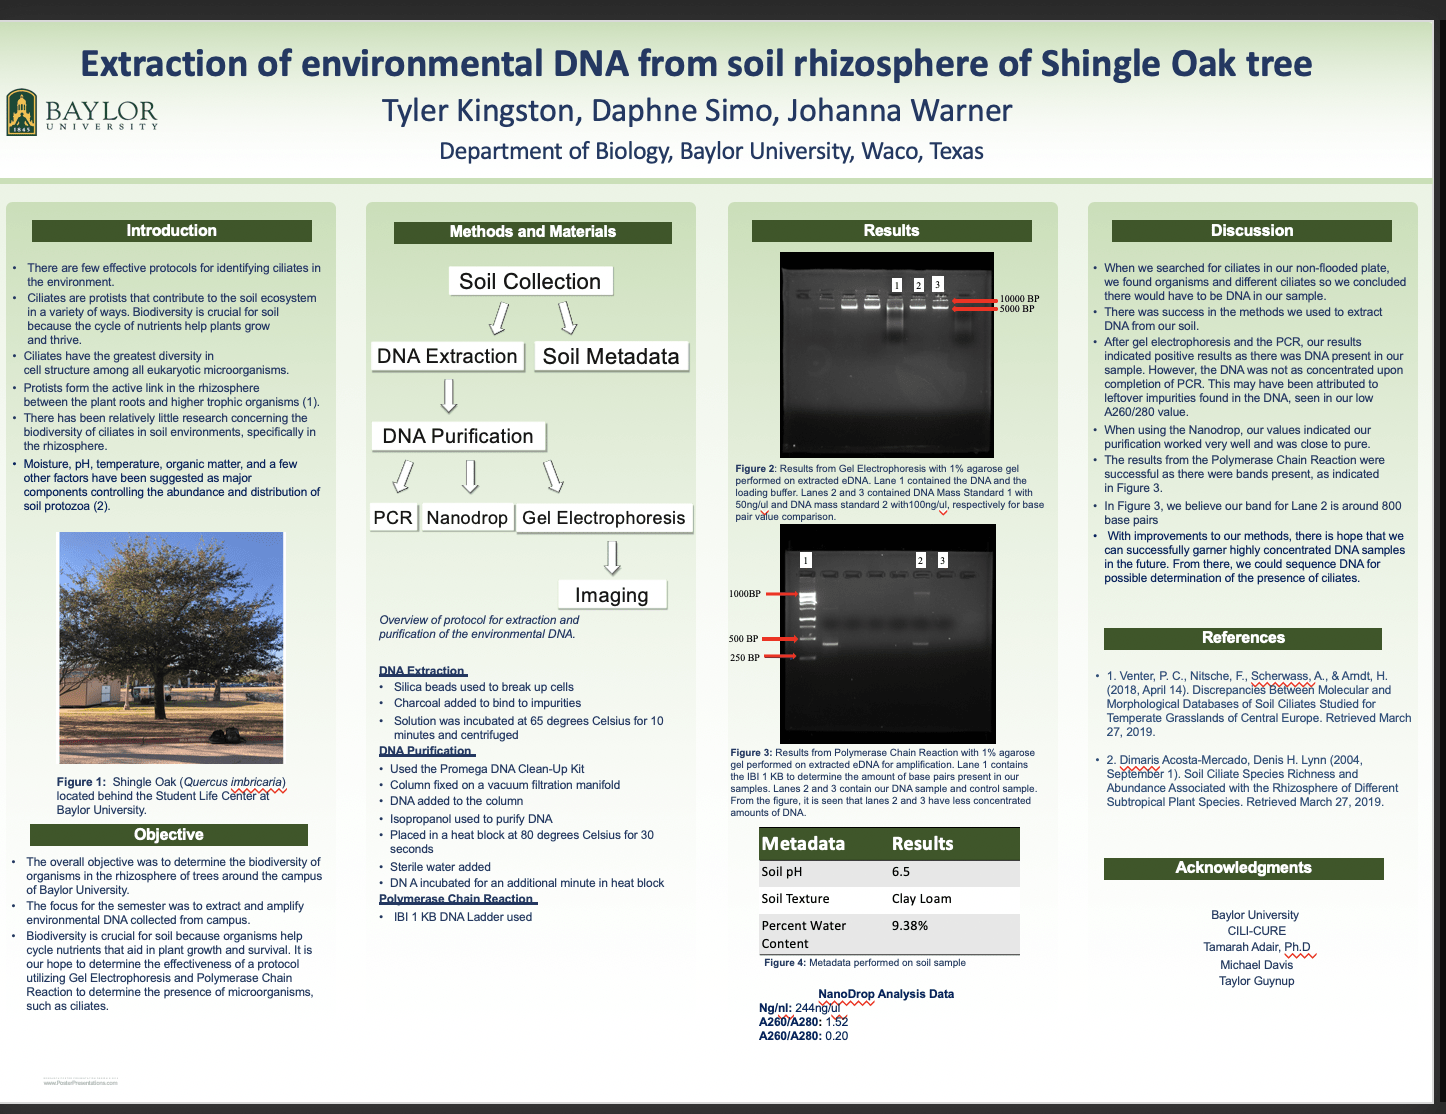
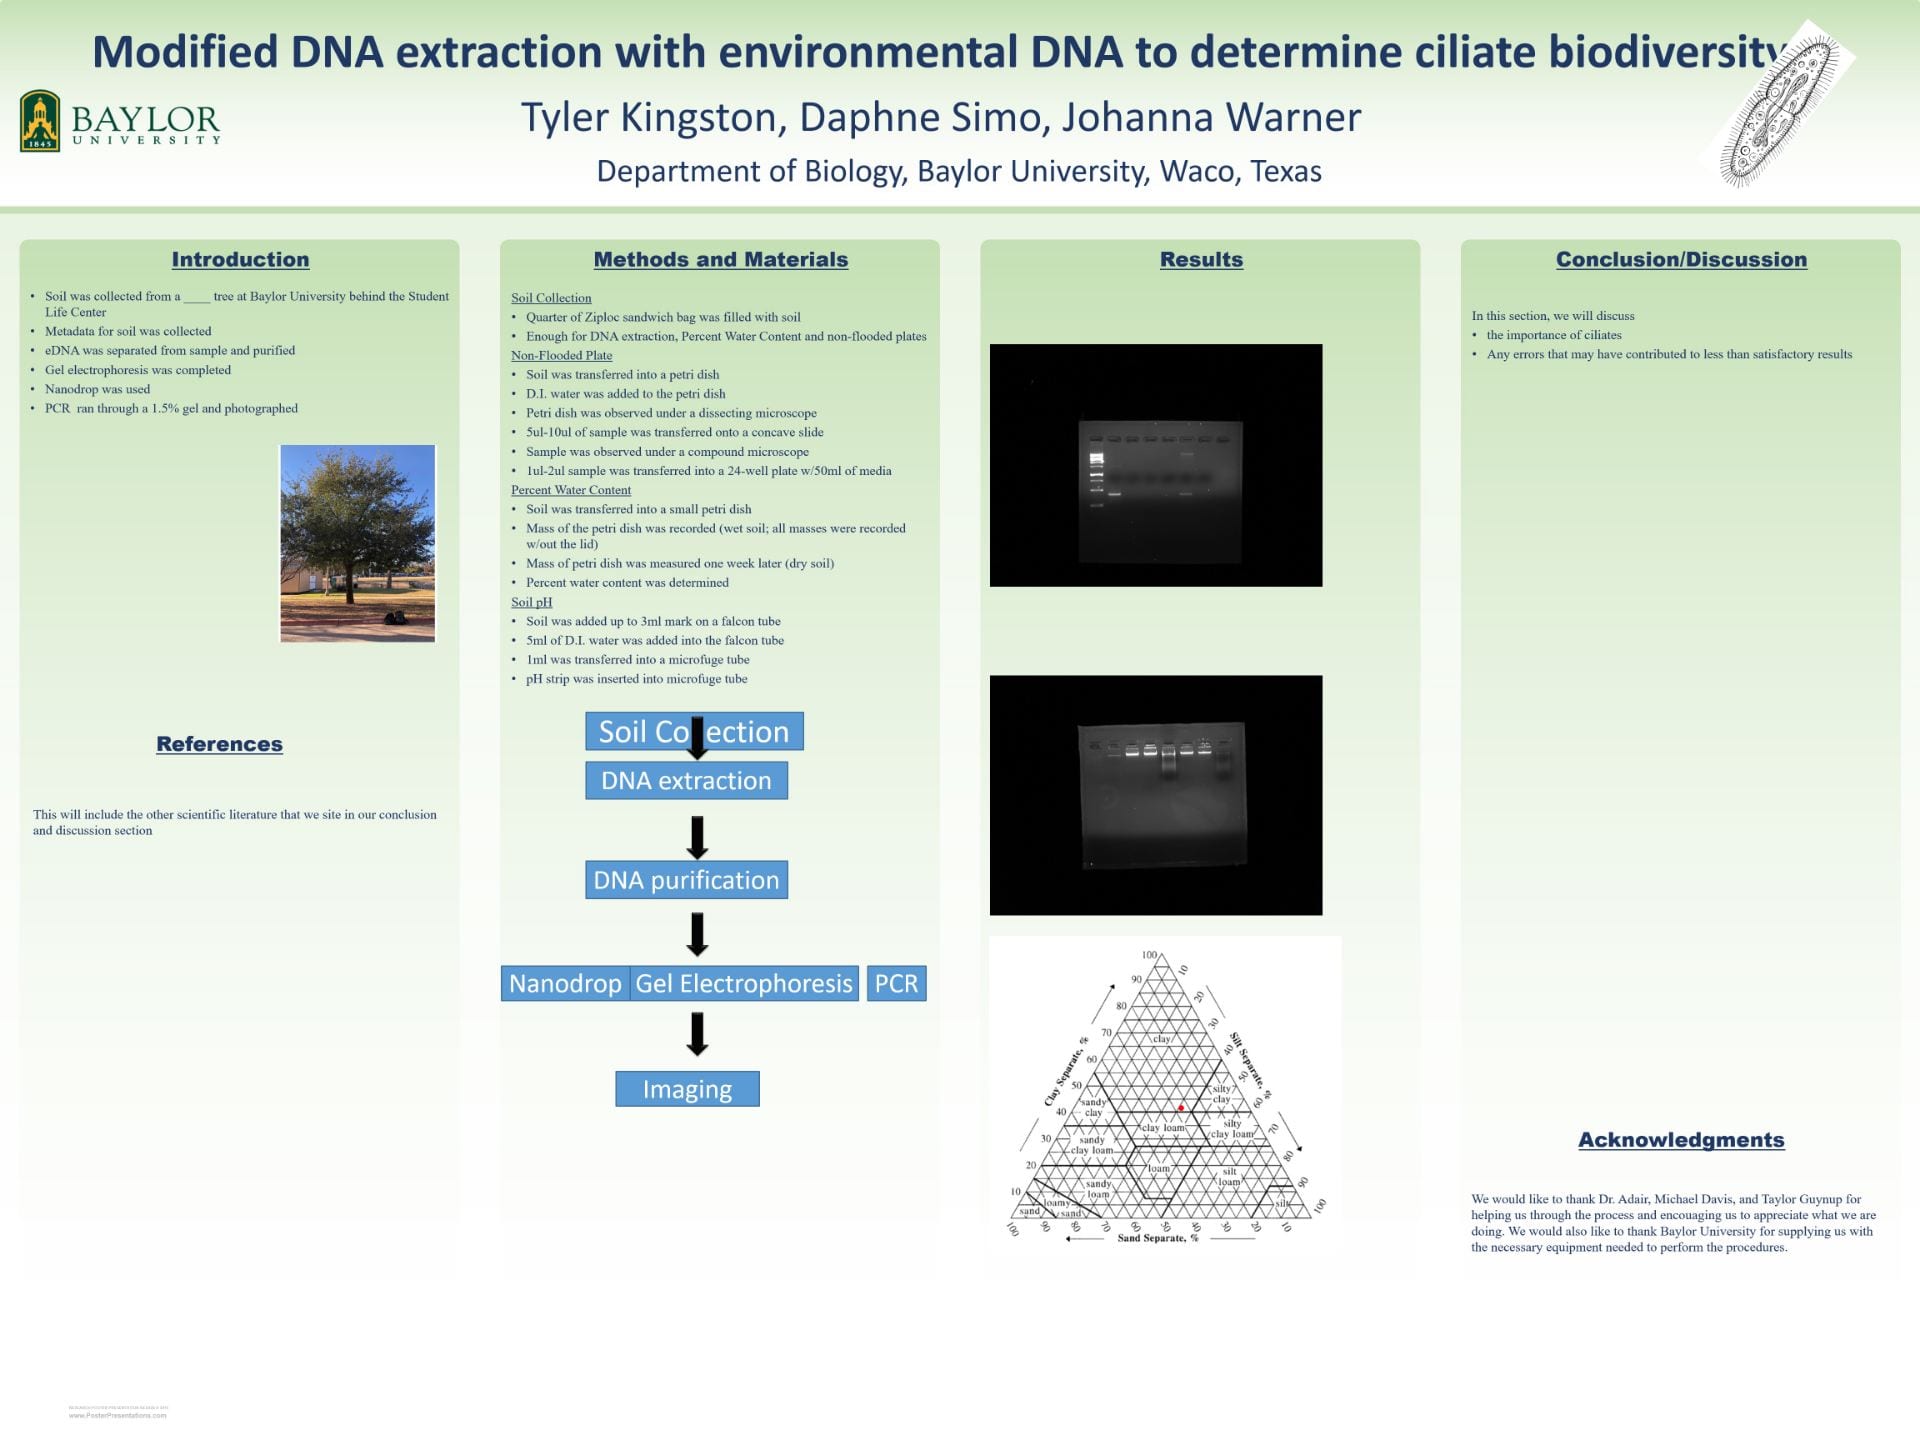
Extraction of environmental DNA from the soil rhizosphere of Shingle Oak tree

The soil rhizosphere of trees have an abundance of ciliates and microorganisms present that have not been subjected to extensive research to analyze their diversity. Ciliates are a group of protists that are distinguished by the absence or presence of cilia. Ciliates are vital in the rhizosphere ecosystem mainly as predators. The purpose of this study was to evaluate the biodiversity of ciliates presence in the rhizosphere of trees on the campus of Baylor University. To determine this, a soil sample was collected at a specific site behind the Student Life Center. The soil sample was then used to find its ph, percent water content, and soil texture. An effective protocol was created to extract and purify DNA from the soil. It included silica beads to break up the cells, charcoal to bind to impurities, and isopropanol was used to purify the DNA using a vacuum. DNA was successfully found from the soil sample and the 18s V4 region was amplified. From there, the future goal is to determine the sequence of the DNA.

Poster

VI. STORAGE 

Our finalized abstracts and posters were submitted to Box for future printing.

VII. CONCLUSION

Despite being our second-to-last lab, I believe it was one of the most rewarding session yet. I was able to see all of the work I have done with a single soil sample from campus such as having the ability to extract and purify its DNA and performing a polymerase chain reaction and gel electrophoresis on the eDNA we were able to collect. Furthermore, I have seen advancement in my ability to express my scientific research through writing an abstract and curating a scientific poster.

VIII. FUTURE STEPS

Moving forward, I hope to review all of the processes we have performed on our soil sample this semester and prepare to present my research at the CURES in Bio Symposium in the coming week.

April 19

Lab 13: Soil eDNA Metabarcoding Analysis, Qiime2

Print Friendly, PDF & Email

Daphne Simo

04/19/19

I. TITLE

Soil eDNA Metabarcoding Analysis, Qiime2

II. RATIONALE/PURPOSE

The purpose of this lab was to develop our skillset with utilizing the analysis features on Qiime2 by using a fastq file of an eDNA sample from soil of Bermuda grass in order to understand the genetic diversity of the ciliates present. We were also able to denoise and demultiplex the sequences, while also creating a feature table, a phylogenic tree, and perform taxonomic classification on the sequences.

III. MATERIALS

Qiime2 viewer

Mac Terminal

Computer

IV. PROCEDURE

Qiime2 Moving Pictures Tutorial

  1. Open Terminal on Mac laptop or computer
  2. Reinstall Qiime2 in the temrinal by using the command (source activate qiime2-2019.1)
  3. Download file on Baylor Box named “Cilicure_2018” to create a directory
  4. In finder, highlight and copy the “Cilicure_2018” folder and use the command (cd /Users/daphnesimo/Downloads/CILICURE_2018) in the Terminal to change the directory to the folder
  5. Use the command:qiime tools import \

    –type EMPPairedEndSequences \

    –input-path emp-paired-end-sequences \

    –output-path emp-paired-end-sequences.qza

    to import the sequences from the Bermuda grass as a Qiime2 artifact

  6. Use the commands:qiime demux emp-paired \

    –m-barcodes-file sample-metadata.tsv \

    –m-barcodes-column BarcodeSequence \

    –i-seqs emp-paired-end-sequences.qza \

    –o-per-sample-sequences demux.qza \

    qiime demux summarize \

    –i-data demux.qza \

    –o-visualization demux.qzv

    to demultiplex the sample sequences.

  7. Use the commands:qiime dada2 denoise-paired \

    –i-demultiplexed-seqs demux.qza \

    –p-trunc-len-f 220 \

    –p-trunc-len-r 220 \

    –o-table table.qza \

    –o-representative-sequences rep-seqs.qza \

    –o-denoising-stats denoising-stats.qza


    qiime feature-table summarize \

    –i-table table.qza \

    –o-visualization table.qzv \

    –m-sample-metadata-file sample-metadata.tsv

    qiime feature-table tabulate-seqs \

    –i-data rep-seqs.qza \

    –o-visualization rep-seqs.qzv

    qiime metadata tabulate \

    –m-input-file denoising-stats.qza \

    –o-visualization denoising-stats.qzv

    to denoise the sequences via DADA2 and create a feature table with those sequences.

  8. Use the command:qiime phylogeny align-to-tree-mafft-fasttree \

    –i-sequences rep-seqs.qza \

    –o-alignment aligned-rep-seqs.qza \

    –o-masked-alignment masked-aligned-rep-seqs.qza \

    –o-tree unrooted-tree.qza \

    –o-rooted-tree rooted-tree.qza

    to create a phylogenetic tree using the sequences

  9. Use the commands:qiime feature-classifier classify-sklearn –i-classifier silva-132-99-515-806-nb-classifier.qza –i-reads rep-seqs.qza –o-classification taxonomy.qza


    qiime metadata tabulate \

    –m-input-file taxonomy.qza \

    –o-visualization taxonomy.qzv


    qiime taxa barplot \

    –i-table table.qza \

    –i-taxonomy taxonomy.qza \

    –m-metadata-file sample-metadata.tsv \

    –o-visualization taxa-bar-plots.qzv

    to do a taxonomic classification on the sequences.

  10. Go onto the Qiime2 viewer and view the “taxononmy.qzv and taxa-bar-plots.qzv” fastq files to view the sequences.
  11. Select a ciliate from “taxonomy.qzv” file sample and BLAST it.
  12. Find an article on PubMed over the selected ciliate that was used with BLAST.

V. DATA/OBSERVATIONS

Image: Visualization of “taxa-bar-plot.qzv” file at Level 7 classification.

Image: Quality Plots of “demux.qzv” file,  forward and reverse reads of the demultiplexed sequences.

VI. STORAGE 

Lab computers were shut down for further use. Terminal commands were written down or saved on computer for future reference.

VII. CONCLUSION

I believe that this lab was very beneficial in helping us analyze the diversity of microorganisms such as ciliates in an eDNA sample similar to our own that we will be using Qiime2 in the future with. By using the Qiime2 viewer, we were able to see the differences in ciliate diversity between the Chelex-extraced and the Powersoil eDNA samples to see how each protocol differed in the amount and type of ciliates present. It was interesting to see how the presence of specific ciliates can inform us about their function in the soil rhizosphere by using PubMed to read about them. It will hopefully provide us insight on the roles each of the ciliates play as we begin to piece together their functions.

VIII. FUTURE STEPS

Moving forward, I hope to be able to BLAST and read about more ciliates in order to address questions I had over how the differing roles of the ciliates worked together to achieve some sort of ecological balance in the rhizosphere they all belonged to.

March 29

Lab 10: Next Generation Sequencing and Metabarcoding

Print Friendly, PDF & Email

Daphne Simo

03/29/19

I. TITLE

Next Generation Sequencing and Metabarcoding

II. RATIONALE/PURPOSE

The purpose of this lab was to introduce us to Next Generation and Illumina sequencing methods, which will be utilized to produce DNA sequences for our extracted environmental DNA. Furthermore, we were introduced to CyVerse, a database to perform data analysis on large genomic datasets.

III. MATERIALS

Next Generation Sequencing card activity

Computer

IV. PROCEDURE

NGS Powerpoint Presentation / Card Activity

  1. Meet in computer lab A305.
  2. Listen closely to presentation about Next Generation Sequencing and Illumina High Throughput Sequencing.
  3. Take notes if necessary.
  4. Use knowledge from powerpoint presentation to complete card activity to organize the steps for Illumina sequencing.
  5. Check for incorrect answers with TA and LA.
  6. Complete QTM over steps of Illumina sequencing and turn it in at the end of lab.

V. DATA/OBSERVATIONS

Steps of Illumina High Throughput Sequencing

  1. Break up genomic DNA into more manageable fragments of around 200 to 600 base pairs by using enzymes or by PCR.
  2. Tag the DNA fragments with short sequences of DNA called adaptors.
  3. Denature the double stranded molecules intro single stranded molecules that have the adaptor and primer binding site via incubating the fragments with sodium hydroxide.
  4. Attach the DNA fragments to the flowcell through complementary binding of the adaptors to the oligos (primers) on the surface of the flowcell.
  5. Replicate the DNA attached to the flowcell to form small clusters of DNA with the same sequence.
  6. Unlabelled nucleotide bases and DNA polymerase are then added to lengthen and join the strands attached to the flowcell.
  7. Double-stranded DNA is then broken down into single-stranded DNA using heat, leaving several million dense cluster of identical DNA sequences.
  8. Primers and fluorescently labelled terminators that stop DNA synthesis are added to the flowcell.
  9. Primer attaches to the DNA being sequenced.
  10. DNA polymerase binds to the primer and adds first fluorescently-labelled terminator to new DNA strand.
  11. Lasers are passed over the flowcell to activate fluorescent label on the nucleotide base. Different terminator bases reveal a different color when fluoresced.
  12. Fluorescently-labelled terminator group is removed from first base to add the next fluorescently-labelled terminator. This process continues until millions of clusters are sequenced.


VI. STORAGE 

Lab computers were properly shut down for further use and the card game activity was returned to our TA at the end of class.

VII. CONCLUSION

Having the opportunity to spend a substantial amount of time learning about Next Generation Sequencing was crucial for us to understand how the process works and its role in helping us reach our overall research goal– to metabarcode eDNA to determine biodiversity of ciliates in the rhizosphere of trees. We were able to comprehend the general steps of Illumina sequencing and using metacognitive skills to challenge our knowledge by breaking down the process with a card activity game.

VIII. FUTURE STEPS

Moving forward, I hope to review the steps of Illumina High Throughput Sequencing so I can be confident in my knowledge of the process. I would also like to utilize CyVerse in the near future to understand how metagenomics and data analysis aid in our research.

March 22

Lab 9: Poster Presentations

Print Friendly, PDF & Email

Daphne Simo

03/21/19

I. TITLE

Poster Presentations

II. RATIONALE/PURPOSE

The purpose of this lab was to present our rough draft of the scientific poster that we are to present in the future at the CURES in Bio Symposium. This was to demonstrate our understanding of how to properly present a scientific poster.

III. MATERIALS

Scientific Poster on Powerpoint

Presentation Rubric

IV. PROCEDURE

Powerpoint Presentation

  1. Meet in computer lab A305.
  2. Obtain a rubric from your LA.
  3. Respectfully pay attention to others presentations, making sure to write constructive criticism for them.
  4. Present own our poster.
  5. Make necessary edits after reviewing feedback from Dr. Adair, TA, and LA.

V. DATA/OBSERVATIONS

Image: Poster design rough draft

VI. STORAGE 

Materials did not need to be stored away during this lab meeting. However, edits made to the poster presentations were saved and the lab computers were properly shut down for further use.

VII. CONCLUSION

I believe presenting the scientific posters at our lab meeting was very beneficial as we received feedback to improve them, as well as our style of effectively communicating our results. On the other hand, we received a great amount of feedback that we will use in the future to enhance our poster presentation at the CURES in Bio Symposium. For instance, our methods and materials section was very lengthy, so we would need shorten it extensively and only include portions of it that the judges may have questions on. Furthermore, we need to change our conclusion because it states that our results were negative, although we extracted a great amount of DNA from our sample. We also need to change our title as we have not delved into determining the ciliate biodiversity in our research yet, so we need to only talk about what we have done so far. Lastly, our group needs to find more professional figures to use to improve the aesthetics and professionalism of our poster.

VIII. FUTURE STEPS

Moving forward, I hope to take all of the feedback we received from this lab meeting and use it to improve our poster for the CURES in Bio Symposium. Likewise, I would like to evoke more confidence in how knowledgable I am in terms of explaining the research so I can communicate what I have done in a good manner.

March 8

Lab 8: PCR Results and Scientific Design

Print Friendly, PDF & Email

Daphne Simo

03/08/19

I. TITLE

PCR Results and Scientific Design

II. RATIONALE/PURPOSE

The purpose of this lab was to conduct PCR gel electrophoresis on our DNA and from there, determine if the results indicate that our samples need further sequencing. Furthermore, we spent time in lab creating a rough draft of our scientific poster that we are to present in the future at the CURES in Bio Symposium.

III. MATERIALS

Control and treatment DNA samples

1.5% agarose electrophoresis gel

1 kb ladder sample

Micropipettor

Electrophoresis box


IV. PROCEDURE

PCR Results

  1. Obtain the control and treatment DNA samples, 1.5% agarose gel, and 1 kb ladder sample
  2. Using a micropipettor, place 5µl of the 1 kb ladder into a lane
  3. Place 10µl of each sample into different lanes
  4. Place the created gel into the electrophoresis chamber, making sure the wells are placed facing the negative side
  5. Run the gels for 30 minutes at 100v

V. DATA/OBSERVATIONS

Image: Poster design rough draft

VI. STORAGE 

The gels were properly placed in an area around 4˚C. In terms of poster design, we made sure to log out of our computers.

VII. CONCLUSION

Performing this lab allowed us to finally be able to determine if our DNA samples are good enough to not have to conduct another sequencing. Furthermore, I am eager to be one step closer to receive the data necessary to determine if we are able to identify diversity in ciliates in the rhizosphere at Baylor University.

VIII. FUTURE STEPS

Moving forward, I hope to create a more in-depth poster design for the CURES in Bio Symposium so I can share with others what we have done in this research course. On the other hand, I would like to be able to receive the final data necessary from our DNA samples so I can start to analyze the significance and meaning of the results.

March 1

Lab 7: PCR Amplification of DNA

Print Friendly, PDF & Email

Daphne Simo

03/01/19

I. TITLE

PCR Amplification of DNA

II. RATIONALE/PURPOSE

The purpose of this lab was to perform a polymerase chain reaction on our chelex DNA or eDNA.

III. MATERIALS

Purified DNA sample

Taq mix

Euk Primer


Micropipettor

Water

Microfuge tubes

Centrifuge

Ice

Small container

IV. PROCEDURE 

Aseptic Preparation

  1. Wear gloves.
  2. Clean lab table with 10% bleach.

Polymerase Chain Reaction procedure

  1. Collect tubes of primer, purified DNA, water, and taq mix and place into a small container with ice.
  2. Obtaining one microfuge tube, place 12.5μl of 2x taq mix, 2μl of purified DNA, 1μl of 10μM primer, and 10.5μl of water into it.
  3. Obtaining a new microfuge tube, place 12.5μl of 2x taq mix, , 1μl of 10μM primer, and 12.5μl of water into it.
  4. Label the first microfuge tube as treatment and the other as control.
  5. Place the two microfuge tubes into a centrifuge for about 1 minute, while balanced, to make sure all the components are mixed well.
  6. Place the control and treatment tubes into specified wells.

V. DATA/OBSERVATIONS

Tube 1 (Control) 2 (Extracted DNA)
2x Taq Mix 12.5 12.5
DNA (μl) 0 2
10 μM primers (μl) 1 1
Water (μl) 11.5 10.5
Total Volume (μl) 25 25


VI. STORAGE 

The water, primers, 2x taq mix, and DNA were placed back into the coolers. The microfuge tubes with and without the DNA were placed into c5 and c6 wells accordingly.

VII. CONCLUSION

This was my first encounter with polymerase chain reaction in terms of learning what it is and actually performing one. The process was very straightforward, however there was a bit of math involved trying to make sure the concentration of the purified DNA matched with the other components (primer, taq mix, etc.). This was due to the fact that our purified DNA was around 244ng/μl, which was close to the goal of 100ng/μl, so if we were to perform a 1:10 dilution, our DNA concentration would be lower. Instead, we chose to do a 1:1 dilution, and it worked out well.

VIII. FUTURE STEPS

Moving forward, I hope to see good results after we denature the DNA. I want to learn more about how the DNA anneals, as the process confused me a bit. Furthermore, I hope to have a good grasps on the concepts we learned this semester so I can do well on the midterm quiz next time we are in lab.

February 22

Lab 6: Gel Electrophoresis and DNA Analysis

Print Friendly, PDF & Email

Daphne Simo

02/22/19

I. TITLE

Gel Electrophoresis and DNA Analysis

II. RATIONALE/PURPOSE

The purpose of this lab was to perform gel electrophoresis on the DNA samples we purified last week. Furthermore, we used a nanodrop spectrophotometer to quantify and assess the purity of our DNA sample after performing a DNA purification method. The DNA samples were compared to selected DNA Mass Standards via gel electrophoresis to approximate its size.

III. MATERIALS

Purified DNA sample

10x Loading Buffer

Microfuge Tube

DNA Mass Standard “500” 100ng/μL

DNA Mass Standard “250” 50ng/μL

Micropipettor

Gel electrophoresis box

IV. PROCEDURE

Gel Electrophoresis Preparation

  1. Load 1 gel electrophoresis box per table.
  2. Obtain 2 DNA mass standards with one being high (250ng – 50ng) and  low (15ng – 125ng).
  3. Draw and label your gel box, describing what is happening in each well
  4. Determine number of wells needed
  5. Practice loading into a model gel electrophoresis box before doing your own DNA sample and standards.

Gel Electrophoresis 

  1. Collect purified DNA sample from cooler and a microfuge tube
  2. Pipette 9μL of the purified DNA sample into the microfuge tube
  3. Using a new pipette tip, pipette 1μL of 10x loading buffer into the the microfuge tube containing the purified DNA.
  4. Mix the purified DNA and loading buffer solution together with a centrifuge for about 1 minute. Alternatively, lightly flick the tube to stir the components together.
  5. Referring back to the well model drawing, determine where the DNA sample and the two mass standards will be placed in each well.
  6. Load 10μL of the DNA sample into well 5 via a micropipettor.
  7. Load 5μL of DNA Mass Standard “500” 100ng/μL into lane 6.
  8. Load 5μL of DNA Mass Standard “250” 50ng/μL into lane 7.
  9. Attach the lid back onto the gel electrophoresis box with the negative and positive sides properly attached.
  10. Run the gel at 100V for 20 minutes.
  11. Once the 20 minutes are up, transport the gel electrophoresis box to view with a UV light.
  12. Place purified DNA sample on a nanodrop spectrophotometer to quantify and assess the purity of its DNA.

V. DATA/OBSERVATIONS

Gel Electrophoresis Box model

Lane 1 Lane 2 Lane 3 Lane 4 Lane 5 Lane 6 Lane 7 Lane 8
Group 3 DNA Sample


Group 3

5μL “15” Mass Standard  


Group 3

5μL “250” Mass Standard

Group 3

5μL “500” Mass Standard

Our DNA sample (9μL DNA, 1μL loading buffer) 5μL “250” Mass Standard 5μL “500” Mass Standard Group 3 DNA Sample redo


Image: Gel chambers with purified DNA samples and DNA Mass Standards viewed under UV light

Spectrophotometer data

ng/μL: 244

A260/A280: 1.52

A260/A230: 0.20

VI. STORAGE 

The gel electrophoresis box was stored away by our lab assistants properly. Our purified DNA samples and mass standards were placed back into the cooler.

VII. CONCLUSION

It was very exciting working with the Nanodrop spectrophotometer and UV viewer to see the DNA in our sample. Our sample created a good curve, however it was slightly behind the 260 mark. After performing this lab, I was quite shocked to see how unpurified our DNA sample was upon viewing it under the Nanodrop spectrophotometer. We were very thorough in performing the protocol for the purification, but there is definitely always room for human error in any procedure. I am hoping we have another opportunity to re-purify our samples in order to increase the validity of our results.

VIII. FUTURE STEPS

Moving forward, I hope to have the opportunity to re-purify our DNA samples to see if will allow our sample to reach the 290 mark. I hope to analyze our data extensively to understand our DNA more and what it means in our overall research question.

February 15

Lab 5: DNA Extraction Part 2

Print Friendly, PDF & Email

Daphne Simo

02/15/19

I. TITLE

DNA Extraction Part 2

II. RATIONALE/PURPOSE

The purpose of this lab was to perform purification of the DNA from our soil samples and create agarose gel in preparation for gel electrophoresis.

III. MATERIALS

Crude soil DNA

Deionized water

DNA resin

15mL tube

Syringe barrel

Column bottom

Vacuum filtration manifold

2mL 80% isopropanol

Centrifuge

Heat block

Tris-EDTA Acetic Acid (TAE)

Erlenmeyer flask

Weighing paper

Microwave

Ethidium bromide

IV. PROCEDURE

DNA Purification

  1. Add 1mL of sterile water into the crude soil DNA if not up to 1mL and place this into a 15mL tube for mixing.
  2. Add 2mL of 37°C DNA resin and mix the solution by inverting the tube.
  3. Set up a column bottom on a syringe barrel and place it on a vacuum filtration manifold.
  4. Turn on the vacuum and add half of the DNA and resin to column.
  5. Gradually add the DNA resin solution through the column after the first set of the sample has gone through the column.
  6. Clean the column by adding 2mL of 80% isopropanol via the vacuum with the same process used to place the DNA resin solution.
    • Repeat the above process for a total of three times.
  7. Remove column from the barrel and place the column into a clean 1.5mL tube.
  8. Place the tube into a centrifuge and spin at 8000 x g for 5 minutes
  9. Take the column out of the 1.5mL tube and place into a heat block for 30 seconds at 80°C, making sure not to exceed a minute.
  10. Put column in a new 1.5mL tube and add 50mL of deionized water directly into the column heated to 80°C .
  11. Incubate the column for 1 minute.
  12. Spin at 8000 x g for 1 minute again.
  13. Label your groups tube.
  14. Measure the concentration of the DNA for each solution on the NanoDrop and run 2μL on a gel with DNA MAss Standards to check the purification and concentration

Agarose Gel Preparation

  1. Weigh out 0.4 grams of agarose powder into a small Erlenmeyer flask using a spatula and weighing paper on a balance.
  2. Put deionized water into the agarose powder and mix the two components together.
  3. Heat the solution in the microwave until the solution is clear and small bubbles rise from the bottom when swirled.
  4. Allow the solution to cool for about 5-6 minutes.
  5. Add 2μL ethidum bromide into the solution once cooled.
  6. Pour the cooled agarose solution into a gel electrophoresis box, making sure no bubbles are present.
  7. Allow the agarose solution to solidify for about 30 minutes

V. DATA/OBSERVATIONS

No data collected for this lab.

VI. STORAGE 

The gel electrophoresis box was stored away by our lab assistants properly. The materials used to create the gel electrophoresis and agarose gel (i.e. were placed into its correct location.

VII. CONCLUSION

Performing this lab allowed me to understand the importance of being very thorough when doing research work. Furthermore, it introduced me to the process of gel electrophoresis and heightened my curiosity of how it works.

VIII. FUTURE STEPS

Moving forward, I hope to have done the DNA purification accurately in order to move on to the next step to answer our overall research question. Likewise, I hope to research more about gel electrophoresis to enhance my knowledge of it.

February 8

Lab 4: DNA Extraction

Print Friendly, PDF & Email

Daphne Simo

02/07/19

I. TITLE

DNA Extraction

II. RATIONALE/PURPOSE

The purpose of this lab was to perform extract DNA from our soil samples utilizing metagenomic methods in preparation to purify the DNA. Furthermore, we determined the soil texture of our samples as data to answer our overraching research question.

III. MATERIALS

Dissecting Microscope

Petri Plates

Soil sample in Falcon tube

Centrifuge

Centrifuge tube

Pipette

Chelex

Heat block

DNA extraction buffer

Silica beads

Mortar and pestle

Activated charcoal

Eppendorf tube

Leaf

IV. PROCEDURE

Soil Texture

  1. Use a ruler to measure the overall amount of soil in sample in centimeters
  2. Measure the amount of sand, silt, and clay present in the overall soil
  3. Use the measurements of each type of texture present and divide by the overall amount of soil in the sample to get the percentage of each type
  4. Use a Soil Triangle and Soil Type Calculator to determine the soil texture

DNA Extraction

  1. Weigh out 1 gram of the selected soil sample and 1 gram of glass silica beads into a dish on a balance
  2. Place the combined soil sample and silica beads into a mortar and begin to grind the components together using a pestle for about 5 minutes
  3. Add 2mL of DNA extraction buffer into the mixture
  4. Add 10mg of powdered activated charcoal into the mixture
  5. Combine the mixture together by pipetting it multiple times
  6. Transfer the mixture into an Eppendorf tube
  7. Incubate the mixture in the Eppendorf tube at 65°C for 10 minutes in a water bath
  8. Centrifuge the tube at 12000g for 5 minutes at 4°C
  9. Take out 500μL of supernatant to a fresh microfuge tube

Tree Metadata

  1. Determine the Genus species of your selected tree
  2. Sketch a detailed drawing of your leaf
  3. Use the “Figure of Leaves” to describe the leaf in as much detail
  4. Put leaf under dissecting microscope to closely observe the leaf for other intricate features

V. DATA/OBSERVATIONS

Soil Texture

Total of sand, silt, and clay: 1.85 cm

Sand: 0.7 cm (0.7/1.85) = (29.73%)

Silt: 0.6 cm  (.85/1.85) = (32.43%)

Clay: 0.55 (0.55/1.85) = (4.76%)

Texture: Clay loam

Image: Falcon tube containing soil sample which was used to measure the soil texture


DNA Extraction


Images: Using a pestle to combine the soil sample and silica beads together (left). Using a micropipettor tip to mix the DNA extraction buffer, activated charcoal, soil sample, and silica beads (right)

Tree Metadata

Genus species: Quercus imbricaria

Tree name: Shingle Oak

Observations: The shape and arrangement best resembled an elliptical and linear leaf. It was oval shaped with a broad point on the top. The leaf was very elongated with parallel margins. Then venation was reticulate with small veins interconnecting. Lastly, the margins were very even and smooth. We determined the Genus species by using the “Identify by Leaf” test.

Image: Leaf sample taken from selected tree (left), Sketch of leaf sample (right)


VI. STORAGE 

The soil samples were stored away per instructions from our professor for future use. On the other hand, the used pipettes and centrifuge tubes were discarded. Microscopes were unplugged and covered and lab tables were thoroughly cleaned off. Our DNA sample was labeled and stored properly.

VII. CONCLUSION

I really enjoyed performing this experiment as it allowed us to delve firsthand into DNA extraction–something many of us may not have done before. It encouraged me to be very meticulous when it came to performing the protocol, as the DNA extraction was a vital aspect of our research in lab. While doing the extraction procedure, we utilized activated charcoal and DNA extraction buffer. The activated charcoal enabled us to extract the impurities , while the DNA extraction buffer chelated the cofactors within our sample. After performing the experiment, it is our hope to find have done it successfully so we can continue the process by purifying the DNA. On the other hand, it was interesting having to draw our leaves in lab. I figured it means that researchers should be multi-faceted in order to perform a vareity of tasks which will consequently help the experiment as a whole.

VIII. FUTURE STEPS

Moving forward, I hope to have done the DNA extraction properly so we can move forward with our research. I hope to also solidify in my mind how each other the steps in the DNA extraction process work as a whole.

February 1

Lab 3: Ciliate Isolation

Print Friendly, PDF & Email

Daphne Simo

01/31/19

I. TITLE

Ciliate Isolation

II. RATIONALE/PURPOSE

The purpose of this lab was to further investigate the characteristics of our soil samples by finding their soil texture and percent water content. Once that was completed, ciliates were isolated and cultured via non-flooded plates or soil-water tubes. Lastly, we discussed possible avenues for experimental designs in relation to our research dealing with metabarcoding ciliates.

III. MATERIALS

Compound Microscope

Dissecting Microscope

Petri Plates

Soil sample

Falcon tube containing soil sample

Dispersion Agent

24-Well Plate

Concavity slide

Micropipettor

IV. PROCEDURE

Ciliate Observation

  1. Retrieve soil sample from concealed container or Falcon tube from test tube rack
  2. View under dissecting microscope to find ciliate movement
  3. Using a micropipettor, obtain around 10-15μl of the sample and place onto a concavity slide
  4. View the concavity slide at 4x and 10x magnification with a compound microscope
  5. If ciliate found, obtain images and videos to use for future classification
  6. Use micropipettor and place it into the 24-well plate with your initials

Percent Water Content

  1. Weigh empty Petri plate
  2. Retrieve soil sample
  3. Using a small Petri plate, pour some of your soil sample into the plate
  4. Weigh the Petri plate with soil

Soil Texture

  1. Obtain Falcon tube with soil sample
  2. Place about two drops of dispersing agent into the Falcon tube
  3. Vortex the Falcon tube for about 1-2 minutes

V. DATA & OBSERVATIONS

Ciliate Observation

Observations: Ciliates found were round and oval in shape, transparent in color, and moved erratically and fast through the layers of the water. They were small in size, in resemblance of particles commonly found in soil.

Video: Ciliate movement observed at 4x objective with MotiCam. 

Percent Water Content

Mass of Empty Petri Dish 3.1g
Mass of Petri Dish + “Wet Soil” 6.8g
Calculate Mass of Wet Soil 3.7g
Mass of Petri Dish + Dry Soil 6.4g
Calculate Mass of Dry Soil 3.3g

(Wet soil – Dry Soil)/ (Wet Soil) * 100 = Percent of Water in Soil

(3.7 – 3.4)/(3.7) * 100 = 8.11% Water in soil

Image: Small Petri plate of soil used to calculate percent water content

VI. STORAGE 

The dissecting and compound microscopes were unplugged and stored away properly. The concavity slides used for viewing ciliates were thoroughly washed and dried off with water and bleach. The Petri plates and falcon tubes containing our soil samples were stored away in their appropriate location for future use.

VII. CONCLUSION

This lab allowed me to collect the data necessary to conduct further research on metabarcoding in the future. Fortunately, I was able to find ciliates in both my non-flooded plate and falcon tube containing my soil sample. This was a great contrast with how my last semester went as I ended up finding ciliates in our last week of lab. I believe this was due to increased patience I developed from previous labs.  Although this lab utilized similar techniques and protocols done in the past, I believe it is crucial to practice learned skills in order to improve our techniques for future experiments, as I have been able to do myself. It was interesting to note that the soil I collected near the creek last semester had less ciliates than the sample I collected near a drier area behind the Student Life Center. This discovery left me to question how much of an area’s water content has an impact on ciliate biodiversity.

VIII. FUTURE STEPS

Moving forward, I hope to refine my lab techniques from last semester in order to increase my efficiency of finding ciliates. Likewise, I am hoping to collect as much ciliate samples in the 24-well plate to observe in preparation for metabarcoding their DNA.