April 26

Print Friendly, PDF & Email

Shivam Patel 4/25

Purpose:  The purpose of the lab was to create abstracts for our poster and finish our posters, as well as label and sort our soil.

Procedure:

1. Label soil bag with your sample ID.

2. Fill in the excell spreadsheet with information of your sample.

2. Finalize abstract and poster.

Abstract:

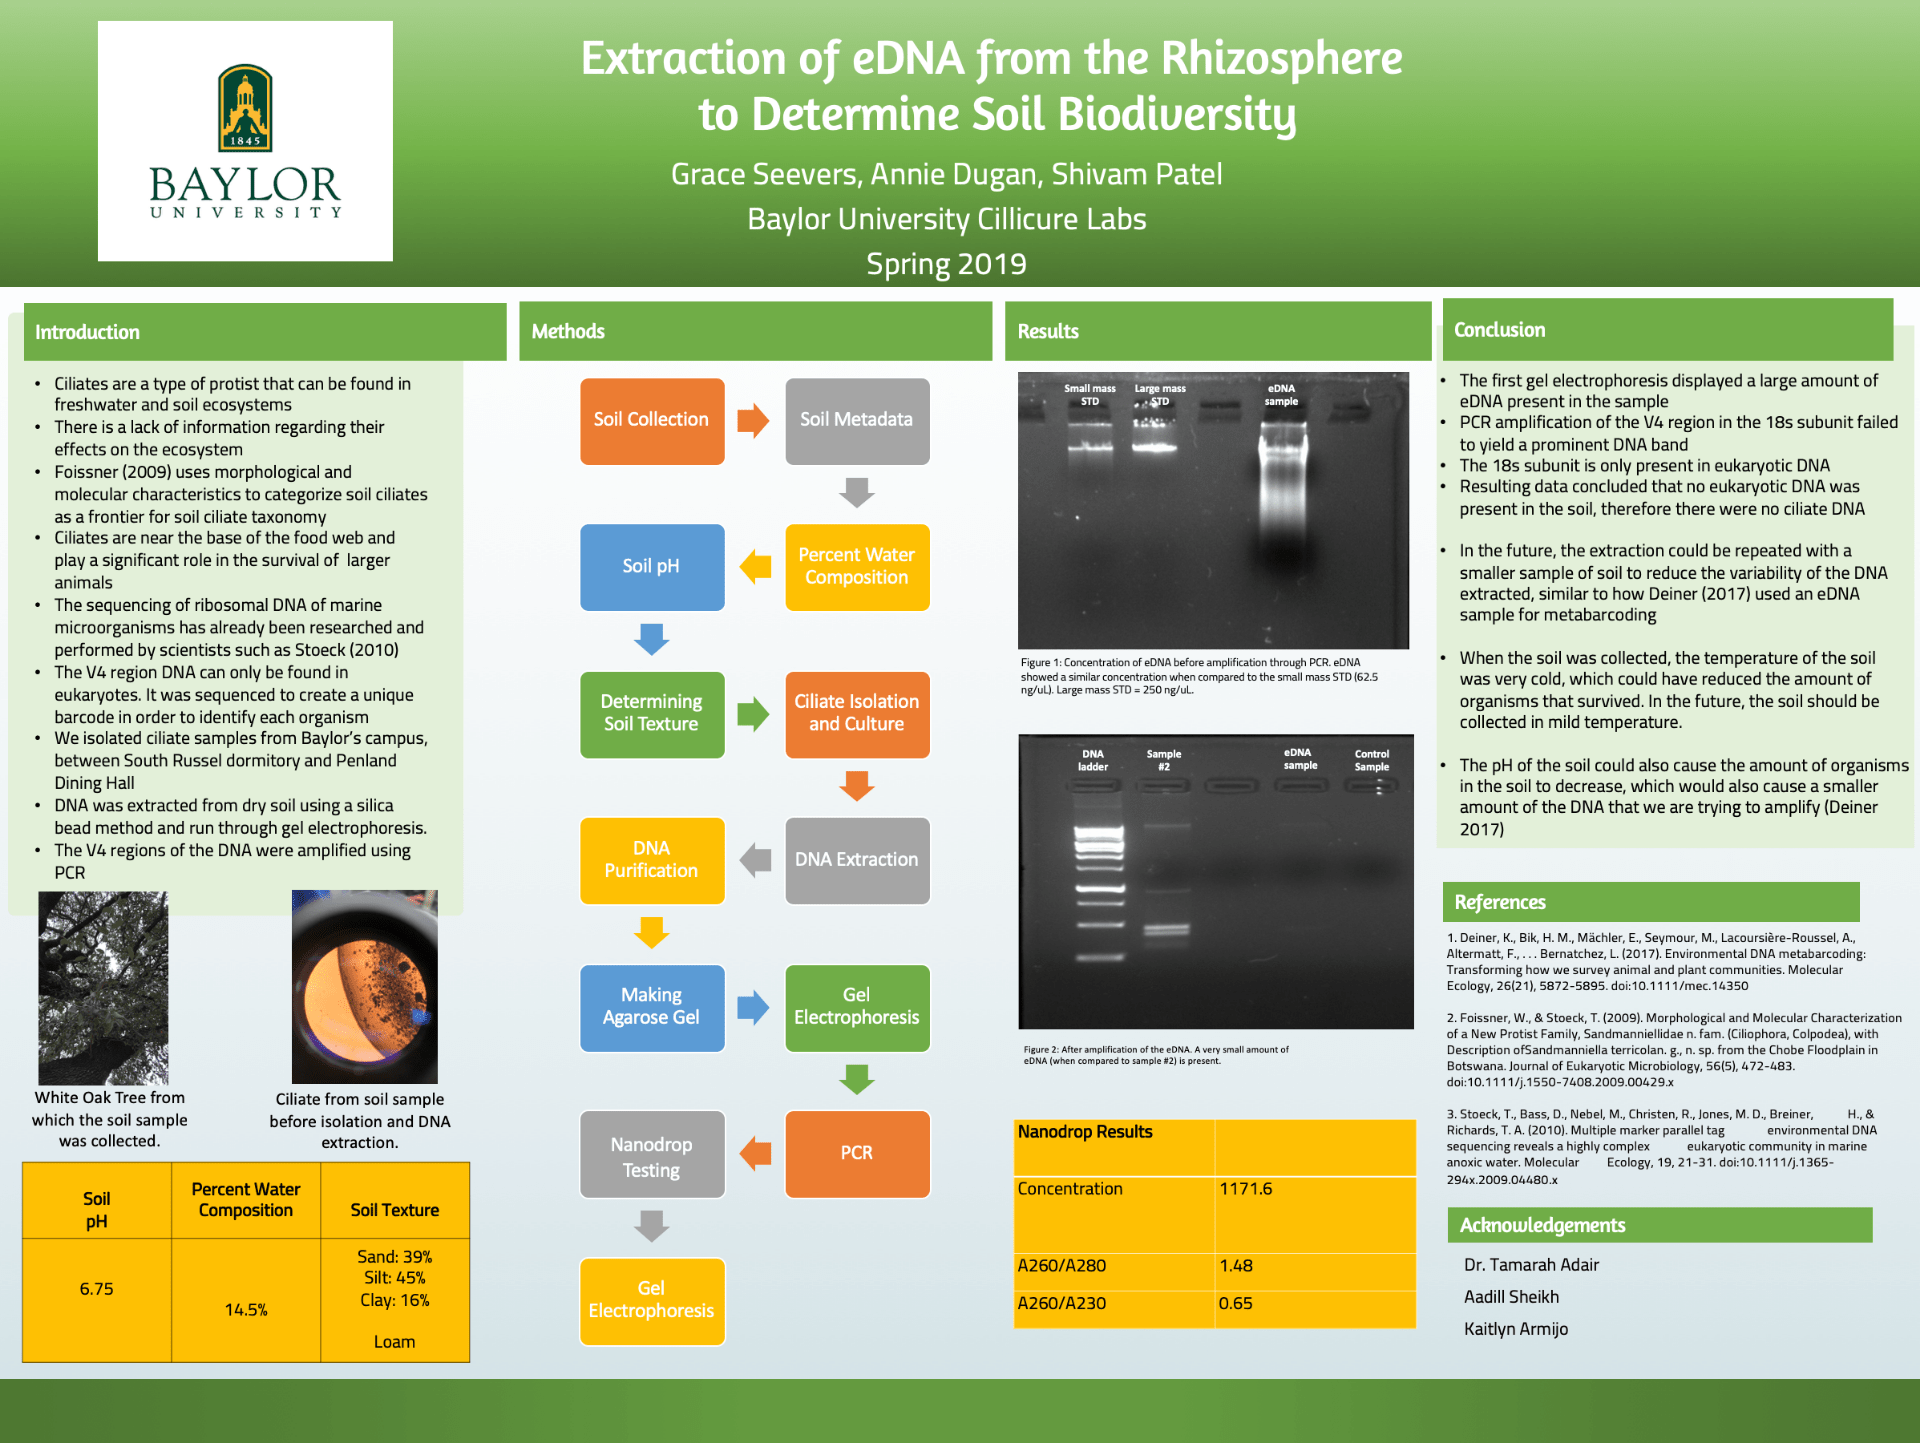
Ciliates are unicellular eukaryotic organisms that reside in freshwater or soil ecosystems. Ciliates are an important factor within the ecosystem because they consume different bacteria and protozoa, and act as a source of nutrition for organisms at higher trophic levels. The enormous discrepancy between the amount of research conducted on ciliates living in marine biomes versus ones living in the soil is due to a general lack of interest and/or knowledge of their importance. This experiment was conducted over the course of fourteen weeks in an effort to fill the gap between the amount of information known about marine and soil biodiversity by determining the overall composition of ciliates living in the rhizosphere of different trees across Baylor University’s campus. The V4 region of the 18S rRNA was observed because it is conserved within all eukaryotes and is unique to each specific organism. Soil samples were collected from the rhizosphere, where the highest concentration of ciliates are presumed to inhabit because of its abundance of nutrients and gas availability. After collection, the soil was searched for the presence of ciliates. Once the ciliates were isolated, their DNA was extracted and purified. The pure DNA was amplified through a polymerase chain reaction and ran through gel electrophoresis to determine whether or not eukaryotic DNA was present. Although our sample contained a very minute amount of DNA, if substantial DNA had been found, it would be sequenced using an online bioinformatics platform- QIIME2, to determine the specific organisms in our sample.

Conclusion: With our poster and abstract finished, now we just need to prepare to present at the symposium.

April 19

Lab 13

Print Friendly, PDF & Email

Shivam Patel 4/19

Purpose: The purpose of the lab was to reinstall QIIME 2 and use it to view different sets of visual data generated using terminal command prompts.

Procedure:

1. Download the file from canvas.

2. Activate environment:

source activate qiime2-2019.1

3. Import tools:

qiime tools import \

–type EMPPairedEndSequences \

–input-path emp-paired-end-sequences \

–output-path emp-paired-end-sequences.qza

4. Demultiplex:

qiime demux emp-paired \

–m-barcodes-file sample-metadata.tsv \

–m-barcodes-column BarcodeSequence \

–i-seqs emp-paired-end-sequences.qza \

–o-per-sample-sequences demux.qza \


qiime demux summarize \

–i-data demux.qza \

–o-visualization demux.qzv

5. Denoise with DADA 2:

qiime dada2 denoise-paired \

–i-demultiplexed-seqs demux.qza \

–p-trunc-len-f 220 \

–p-trunc-len-r 220 \

–o-table table.qza \

–o-representative-sequences rep-seqs.qza \

–o-denoising-stats denoising-stats.qza


qiime feature-table summarize \

–i-table table.qza \

–o-visualization table.qzv \

–m-sample-metadata-file sample-metadata.tsv


qiime feature-table tabulate-seqs \

–i-data rep-seqs.qza \

–o-visualization rep-seqs.qzv


qiime metadata tabulate \

–m-input-file denoising-stats.qza \

–o-visualization denoising-stats.qzv

6. Create a phylogenic tree:

qiime phylogeny align-to-tree-mafft-fasttree \

–i-sequences rep-seqs.qza \

–o-alignment aligned-rep-seqs.qza \

–o-masked-alignment masked-aligned-rep-seqs.qza \

–o-tree unrooted-tree.qza \

–o-rooted-tree rooted-tree.qza

7. Classify with taxonomy:

qiime feature-classifier classify-sklearn –i-classifier silva-132-99-515-806-nb-classifier.qza –i-reads rep-seqs.qza –o-classification taxonomy.qza


qiime metadata tabulate \

–m-input-file taxonomy.qza \

–o-visualization taxonomy.qzv


qiime taxa barplot \

–i-table table.qza \

–i-taxonomy taxonomy.qza \

–m-metadata-file sample-metadata.tsv \

–o-visualization taxa-bar-plots.qzv

Conclusion: Using the files generated from these commands and viewing them using QIIME 2 View let us compare the ciliate DNA composition from Power Soil data and Chelex data. In the future, we can continue analyzing data using QIIME 2 about the ciliate DNA sequences.

April 12

Lab 12- Moving Pictures Tutorial

Print Friendly, PDF & Email

Shivam Patel 4/12/19

Purpose: The purpose of this lab was to perform the steps of converting our sequences into a form for visualization using sample data. We performed each step by using commands in the Terminal application and viewing files with Qiime 2 View.


Procedure:

1. First we downloaded the sample data from the QIIME website. Using the terminal, we created folders to hold the different files we would need to process the data using QIIME 2.

2. We imported the tools we needed using the command:

qiime tools import \
–type EMPSingleEndSequences \
–input-path emp-single-end-sequences \
–output-path emp-single-end-sequences.qza

3.  We then demultiplexed the sequences to find which barcode is assigned to each sample with the command:

qiime demux emp-single \
–i-seqs emp-single-end-sequences.qza \
–m-barcodes-file sample-metadata.tsv \
–m-barcodes-column BarcodeSequence \
–o-per-sample-sequences demux.qza

4. We then converted the qza file to a qva file to summarize the results in a viewable format that we looked at using QIIME View.

qiime demux summarize \
–i-data demux.qza \
–o-visualization demux.qzv

5. We used the DADA2 process to denoise, or detect mistakes and correct the sequence data.

qiime dada2 denoise-single \
–i-demultiplexed-seqs demux.qza \
–p-trim-left 0 \
–p-trunc-len 120 \
–o-representative-sequences rep-seqs-dada2.qza \
–o-table table-dada2.qza \
–o-denoising-stats stats-dada2.qza

6. Then the results were tabulated into a qzv file that we looked at using QIIME View:

qiime metadata tabulate \
–m-input-file stats-dada2.qza \
–o-visualization stats-dada2.qzv


Conclusions and Future Steps: We were able to use the different commands in terminal to create files and convert sample sequence data into a viewable corrected data set using different commands in Terminal. We now have the experience and practice we need to perform the same processes on our real set of sequence data from our soil DNA.


April 5

Lab 11 Terminal Installing and Basic Tutorial

Print Friendly, PDF & Email

Shivam Patel 4/4/19

Purpose: The purpose of the lab was to use the terminal application and learn a few of the steps in analyzing the data from our soil sample DNA sequencing.

Procedure:

1. Download MiniConda and install it using the install wizard that opens.

2. Use the terminal and command “conda update conda”.

3. Once complete, use “conda install wget”.

4. Copy paste the command

wget https://data.qiime2.org/distro/core/qiime2-2019.1-py36-osx-conda.yml

conda env create -n qiime2-2019.1 –file qiime2-2019.1-py36-osx-conda.yml

5. Answer the QTM questions.


Conlusion/Future Steps: We learned how to use some basic commands in the terminal and installed MiniConda. We also learned about different steps we will perform in the future, such as demultiplexing and denoising. We will eventually be able to use QIIME 2 and other platforms from Cyverse to analyze the data we got from our soil sample DNA sequences.

March 29

Lab 10

Print Friendly, PDF & Email

Shivam Patel 3/28/19

Purpose: The purpose of the lab was to learn about Illumina sequencing and the cloud platforms we will use for bioinformatics.

Procedure:

1. Arrange cards in correct order using the powerpoint as a reference.

2. Create an account in Cyverse and record the username.

3. Answer QTM questions.

Illumina Sequencing steps:

  1. Break up genomic DNA into more manageable fragments of around 200 to 600 base pairs by using enzymes or by PCR.
  2. Tag the DNA fragments with short sequences of DNA called adaptors.
  3. Denature the double-stranded molecules into single-stranded molecules that have the adaptor and primers binding site. This is done by incubating the fragments with sodium hydroxide.
  4. Attach the DNA fragments to the flow cell through complementary binding of the adaptors to the oligos (primers) on the surface of the flow cell.
  5. Replicate the DNA attached to the lyocell to form small clusters of DNA with the same sequence.
  6. Unlabeled nucleotide bases and DNA polymerase are then added to lengthen and join the strands of DNA attached to the flow cell. This creates ‘bridges’ of double-stranded DNA between the primers on the flow cell surface.
  7. The double-stranded DNA is then broken down into single-stranded DNA using heat, leaving several million dense clusters of identical DNA sequences.
  8. Primers and fluorescently labeled terminators (a version of nucleotide base- A, C, G, or T- that stop DNA synthesis) are added to the flow cell.
  9. The primer attaches to the DNA being sequenced.
  10. The DNA polymerase then binds to the primer and adds the first fluorescently-labeled terminator to the new DNA strand. Once a base has been added no more bases can be added to the strand of DNA until the terminator base is cut from the DNA.
  11. Lasers are passed over the flow cell to activate the fluorescent label on the nucleotide base. This fluorescence is detected by a camera and recorded on a computer. Each of the terminator bases (A, C, G, and T) give off a different color.
  12. The fluorescently-labeled terminator group is removed from the first base and the next fluorescently-labeled terminator base can be added alongside. And so, the process continues until millions of clusters have been sequenced.

Conclusion:

I have learned how Illumina sequencing works and how to use the different cloud platforms, so I want to utilize this knowledge in our future labs about soil ciliates and the data gathered.

March 22

Lab 9 Posters

Print Friendly, PDF & Email

Shivam Patel 3/21/19

Purpose: The purpose of the lab was to present our poster rough drafts and receive feedback on how to improve them.

Conlusion: We need to:

-change the title

-change methods to bullet points/flow chart and shorten in general

-make results about negative results and why little DNA showed up after PCR

-put space between text in order to make neater and easier to read

-add pictures for intro and remove picture of NanoDrop

March 1

Lab 7 PCR Set up

Print Friendly, PDF & Email

Shivam Patel 2/28

Purpose: The purpose of the lab was to set up our DNA sample for PCR and planning out the basic structure of the poster.

Procedure:

1. Obtain the DNA sample, primer, water, and 2X TAQ mix.

2. Add 1 microliter of primer and 11.5 microliters of water to the control tube containing the TAQ mix.

3. For the sample tube, add 1 microliter primer and 3 microliters of water.

4. Perform a 1:10 dilution of the DNA by combining 1 microliter DNA sample and 9 microliters of water. Perform a second 1:10 dilution by combining 1 microliter of the previous micture with 9 microliters of water. Add 8.5 microliters to the sample tube.

Results:

Tube Control Sample
2X TAQ Polymerase 12.5 12.5
DNA (microliters) 0 8.5
Primter (microliters) 1 1
Water (microliters) 11.5 3
Total Volume (microliters) 25 25

Conclusion: Dr. Adair will perform the PCR process to amplify the DNA samples. The results will then be sent off to identify the ciliates that the DNA belongs to. We can then use that information to map the biodiversity of ciliates around campus.

February 22

Lab 6 Gel Electrophoresis and DNA analysis

Print Friendly, PDF & Email

Shivam Patel

2/21/19

Purpose:

The purpose of the lab was to conduct gel electrophresis using our DNA samples along with the gel that was made. This will let us know if there is enough DNA present in our samples to continue with tests in the future.

Procedure:

1. Put 9 microliters of the sample in the well with 1 microliter of 10X loading buffer that was diluted to 1X.

2. Place the solution into the centrifuge to mix well for 10 seconds.

3. Put 5 microliters of the mass standards in two of the wells.

4. Put the wells on the electrophoresis apparatus.

5. Make sure the wells are on the negative side so that the negatively charged DNA flows to the positive side.

6. Attach the cables and turn on the machine. Let it run at 100 volts for about 25 minutes.

7. Use the NanoDrop machine to analyze the DNA.

Results:

1171.6 ng/microliter

1.48 A260/A280

0.65 A260/A230

Storage: The DNA sample was returned to the fridge and the gel was thrown away in the hazardous waste bin.

Conclusion/Future Steps: We now have the values that describe the DNA that our samples contained. In the future, we can decide what tests we can conduct on our samples to determine the diversity of ciliates on campus.

February 8

Lab 3- Identifying Leaf Characteristics and soil type; conducting DNA extraction

Print Friendly, PDF & Email

Shivam Patel 2/7/19

Purpose:

The purpose of the lab was to use metagenomics to extract DNA from our soil samples. We also identified our soil type and leaf characteristics, and checked if any ciliates were successfully cultured.

Procedure:

1. Obtain a leaf sample from the tree your soil was collected from.

2. Use the provided guides to find and record the various physical characteristics of your leaf.

3. Use a ruler to calculate and record the percentages of sand, silt, and clay from your soil. Using the USDA triangle, identify what type of soil you collected.

4. Measure out 1 gram of soil from your dry soil plate.

5. Add another gram of silicon beads.

6. Transfer into a mortar and grind using the pestle.

7. Add 2 mL of DNA extraction buffer to the mortar.

8. Add 10 mg of activated charcoal to the mixture. Mix using a micro-pipette tip.

9. Use a micro-pipette to transfer the mixture into a Eppendorf tube.

10. Place in heat block at 65 degrees C for 10 minutes.

11. Centrifuge for 5 minutes.

12. Use a micro-pipette to take out as much superlatant as possible without including the soil. Transfer into another Eppendorf tube.


Results:

Leaf: Texas oak; palmately lobed/veined, incised, acuminate, acute.

Soil type: silt-85.71% sand- 9.52% clay- 4.76%     Type: silt

No cilates found in well plate.


Conclusion:

I identified my soil as silt and my tree as a Texas oak. I was able to record multiple characteristics about a leaf from the tree. The setup for DNA extraction was completed, and now we will wait for the results. I did not find any ciliates in my well, so they were not successfully cultured. I might try again in a future lab or during open lab.

February 1

Lab 2 Observing Non-flooded plates under compound and dissecting mircoscopes

Print Friendly, PDF & Email

Shivam Patel 1/31/19

Purpose:

The purpose of the lab was to start observing our non-flooded plates under the two types of microscopes in order to look for ciliates. Any ciliates found were then transferred into a well plate in order to be cultured. We also started the separation process for the soil in a Falcon tube in order to determine what type of soil was collected.


Procedure:

1. Pipette 5 microliters of water from the non-flooded plate onto a concave slide.

2. Look under the microscope for any ciliates or other organisms.

3. Take pictures or videos using the stands.

4. Transfer the water containing ciliates into a well with 1000 microliters of media already inside, then label the lid.

5. Continue looking for more ciliates in the water from the non-flooded plate.

6. Weigh the non-flooded plate without its lid on a balance.

7. Calculate the water content percentage and record.

8. Vortex the Falcon tube for about a minute after adding one drop of dispersing agent from the dropper.

9. Return the Falcon tube, non-flooded plate, and small soil petri dish to be stored when finished.


Results:

non-flooded plate after one week: 34.3 grams

percent water content: 0.87%


Conclusion:

I was able to find at least 2 different kinds of ciliates so far, which means I will be able to run tests and observe them in the future. Last semester I could not find any from my soil sample, so this time was an improvement. Moving forward, I will be checking if cultures of ciliates have developed next week in the well plates. I will also be able to determine the type of soil next week, as the dispersing agent has had enough time to separate the sand, silt, and clay.