10/04/18
Trent McMillan
Lab 7: Materials and Methods-Performing the Experiment-10/04/18
Objective:
The objectives of this lab were: to introduce us to the writing of the materials and methods section of our scientific research paper, apply the skills we learned last week to our own hands-on experiment with the treatment solution to test the effects of polypropylene on Tetrahymena using behavioral assay’s, learn how to use serological pipettors with the bulb, plastic pump, and electronic pump, and to strengthen our dilution/standard deviation skills within the lab.
Procedure:
Absorbance-
- Use the spectrometer to measure the optical density(OD) at wavelength 600nm of each solution.
Solutions-
PPT (clean media), PPT + “twine juice” treated media (clean treated media), PPT + TH (media + tetrahymena), PPT + TJ + TH (treatment + tetrahymena)
Sampling-
-Flask of 50 ml of culture
- Transfer 5 ml of treatment and control into sterile glass tubes using a serological pipette.
- Swirl flask before pipetting.
- Pipette from top of culture
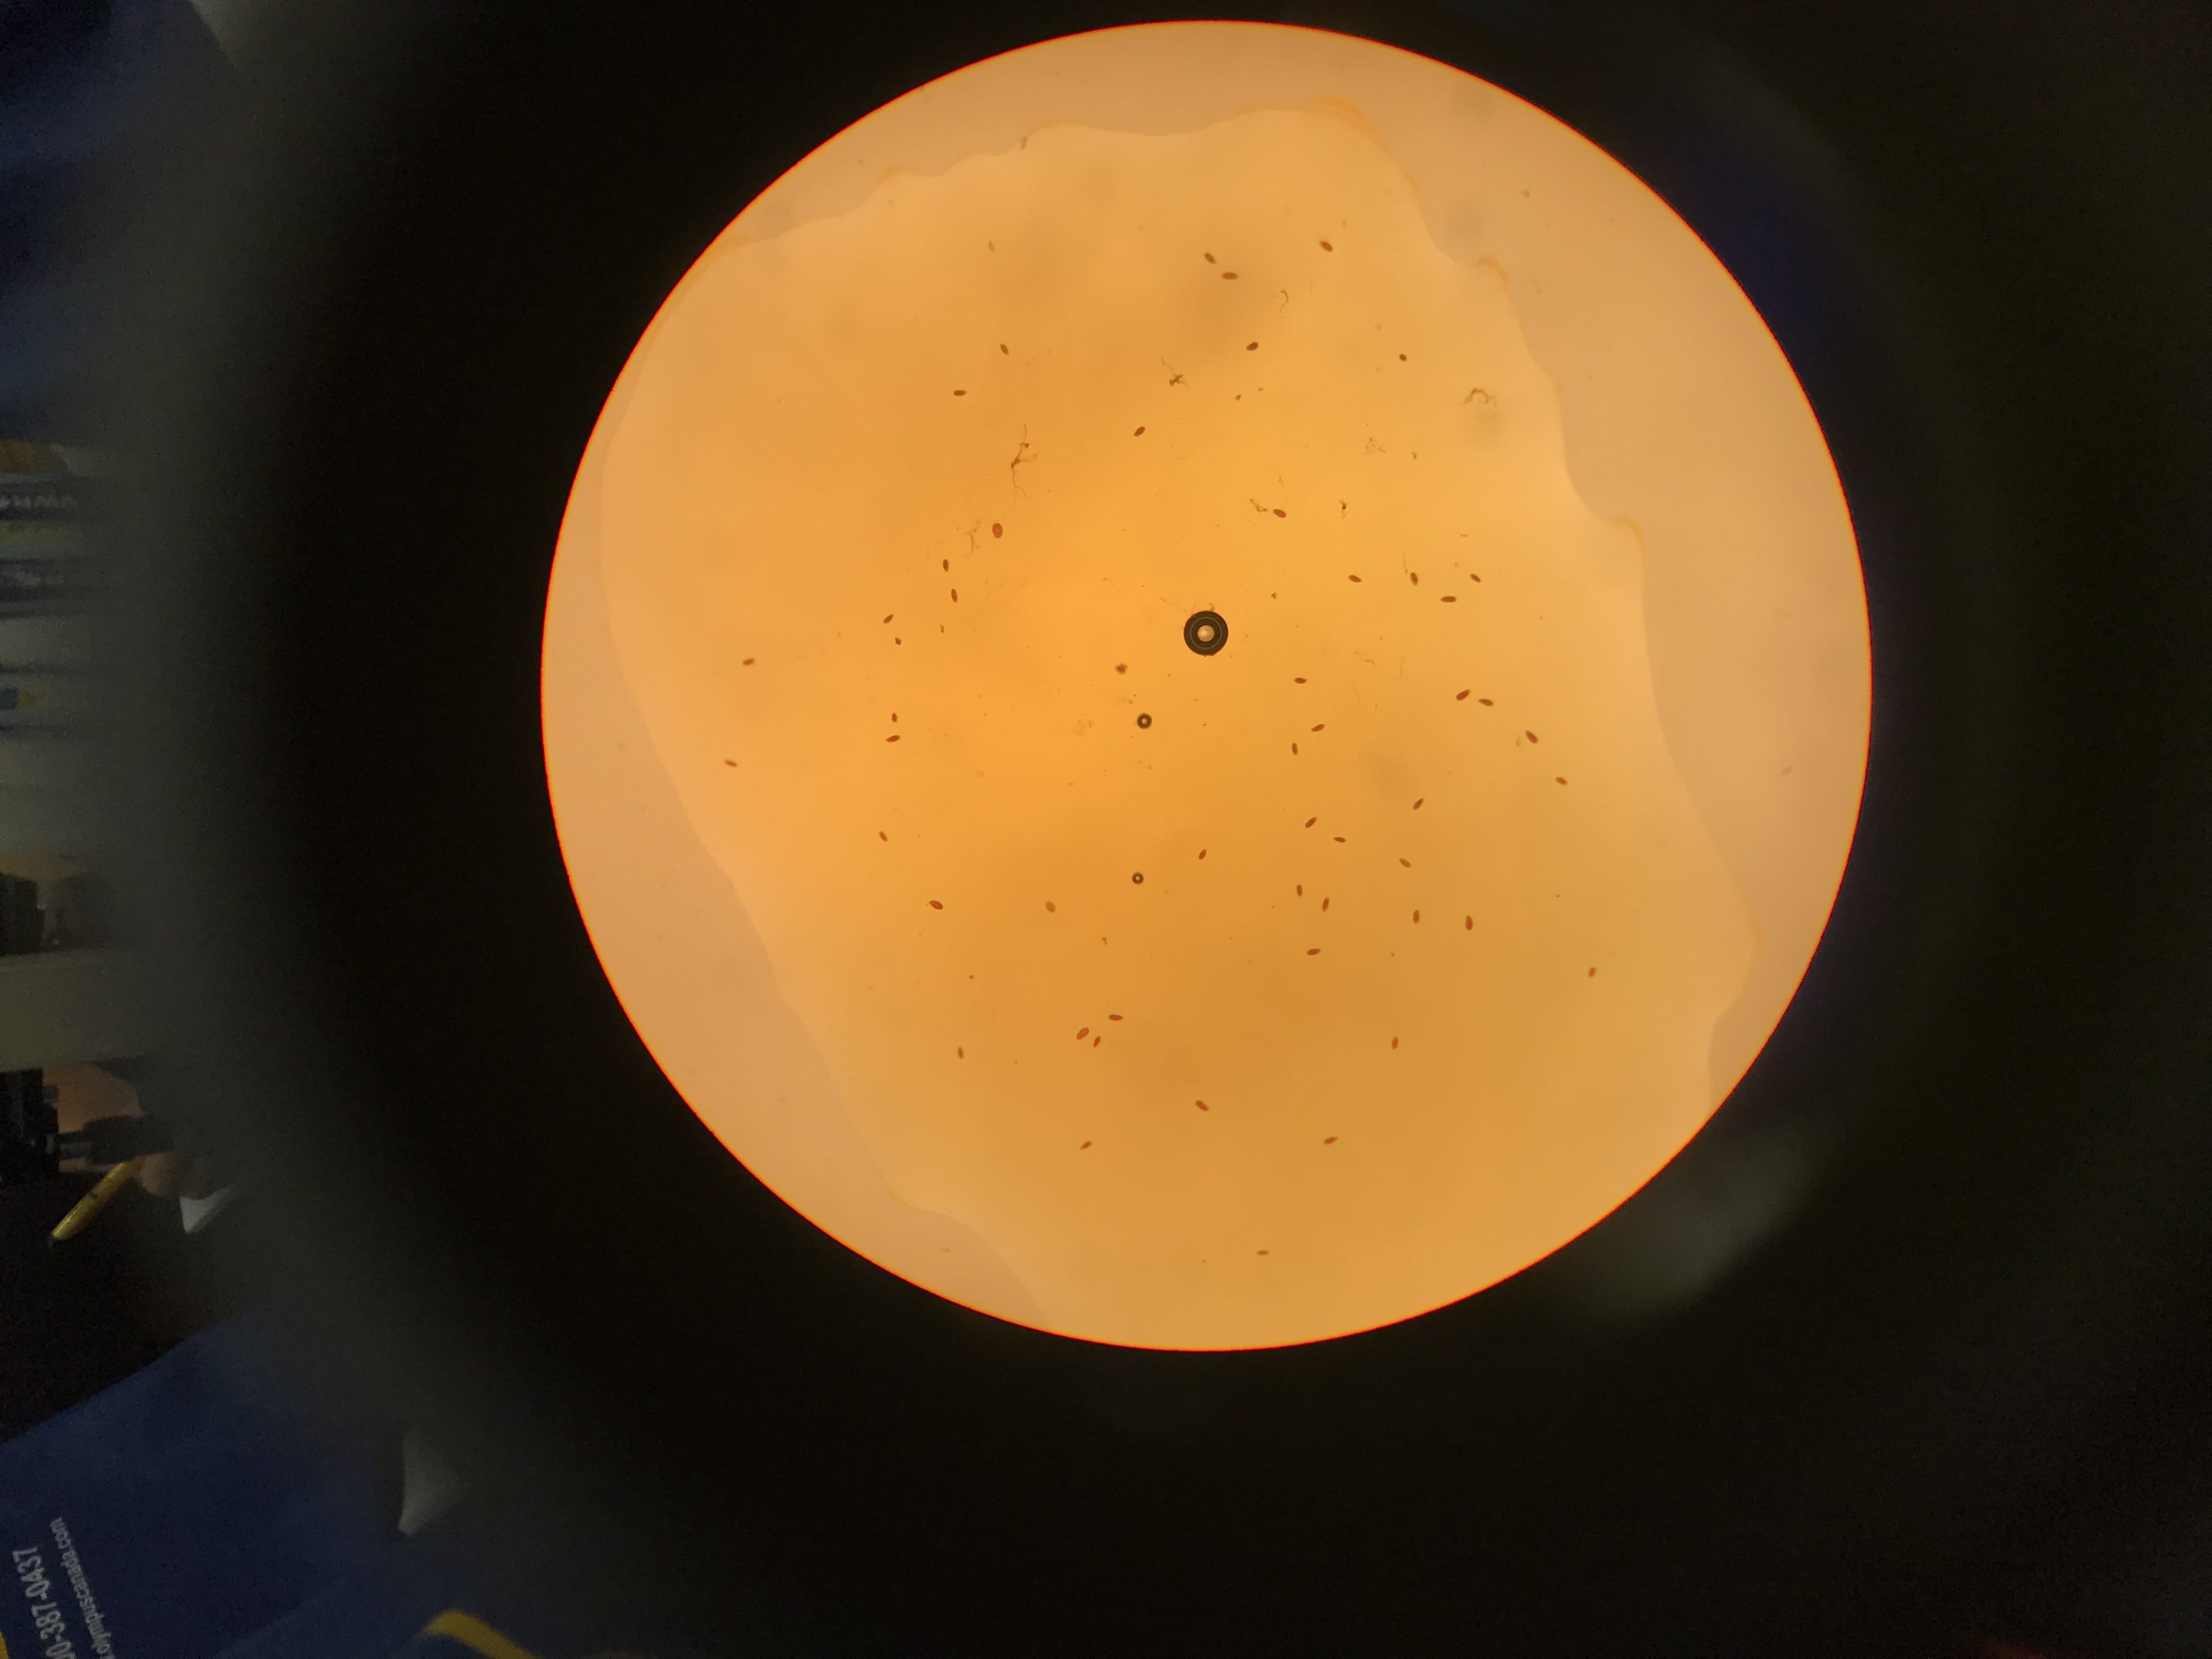
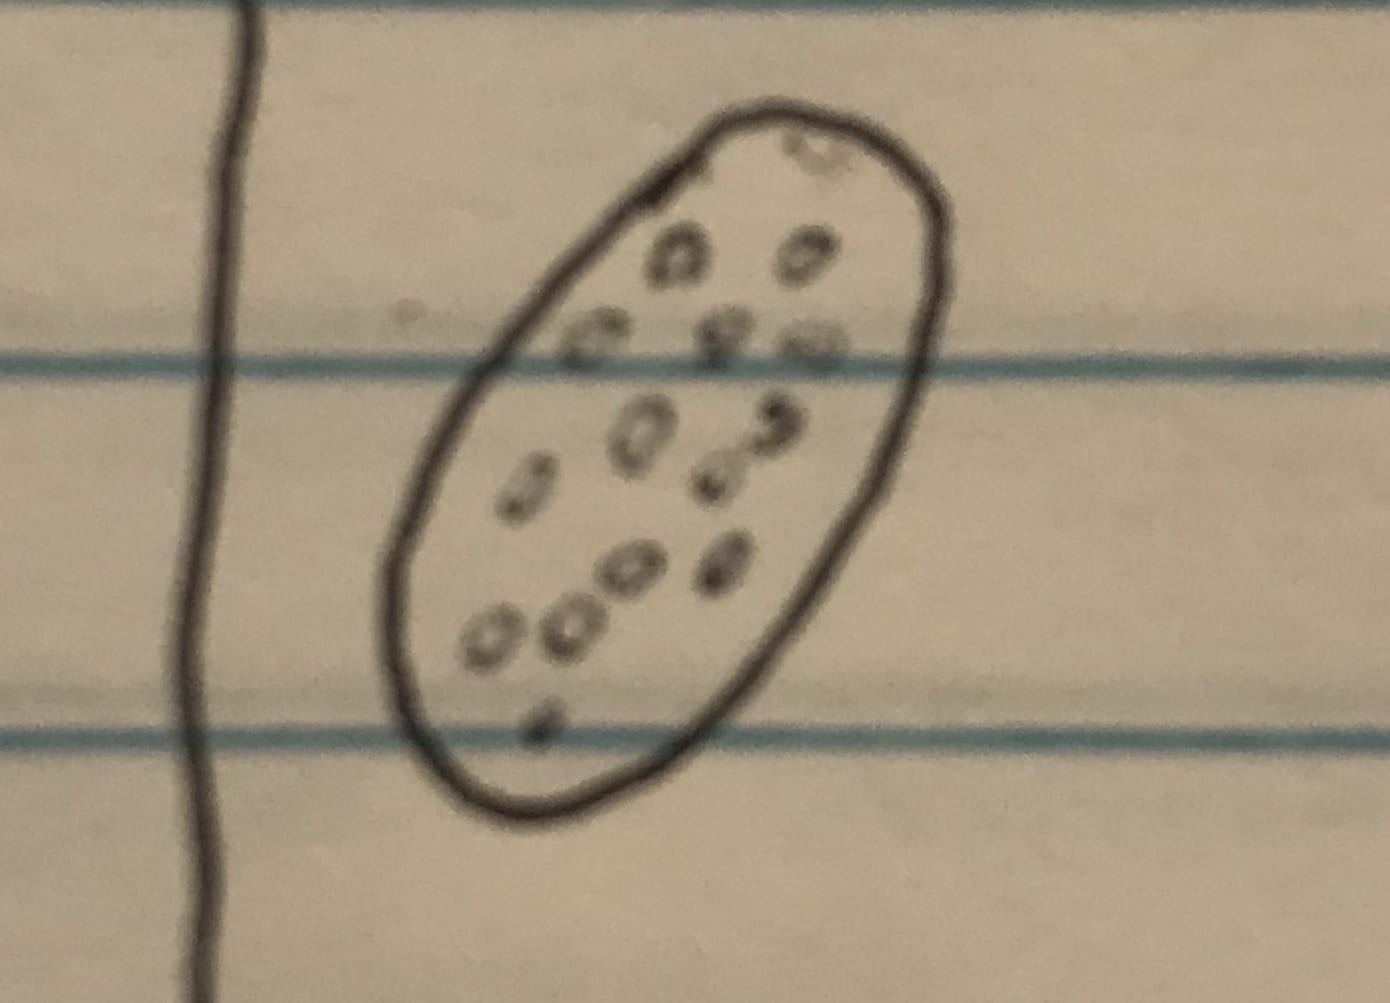
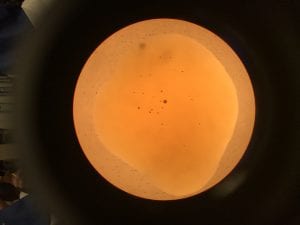
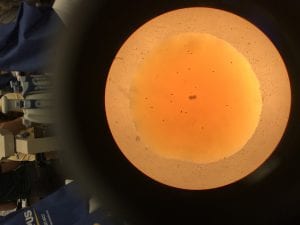
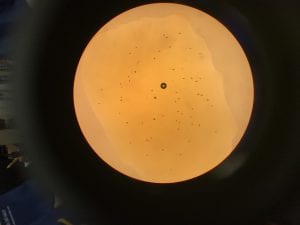
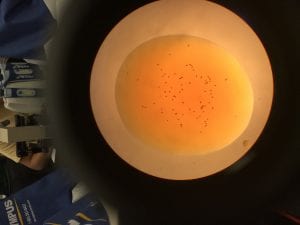
Cell Count Measurements-
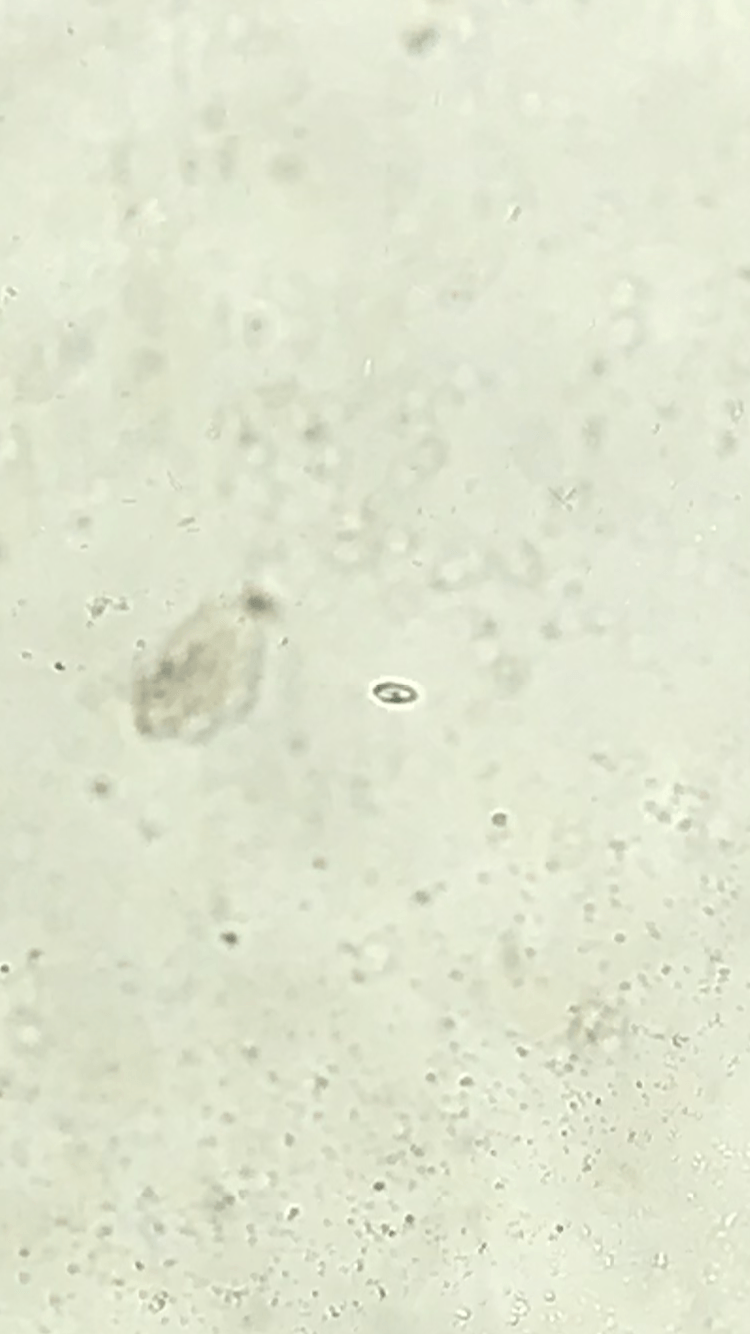
- Everyone count three drops (control & treatment) using 2 μl of Tetrahymena and 1 μl of Iodine; take a picture of each and count later for accuracy.
- Work quickly so the drops don’t evaporate.
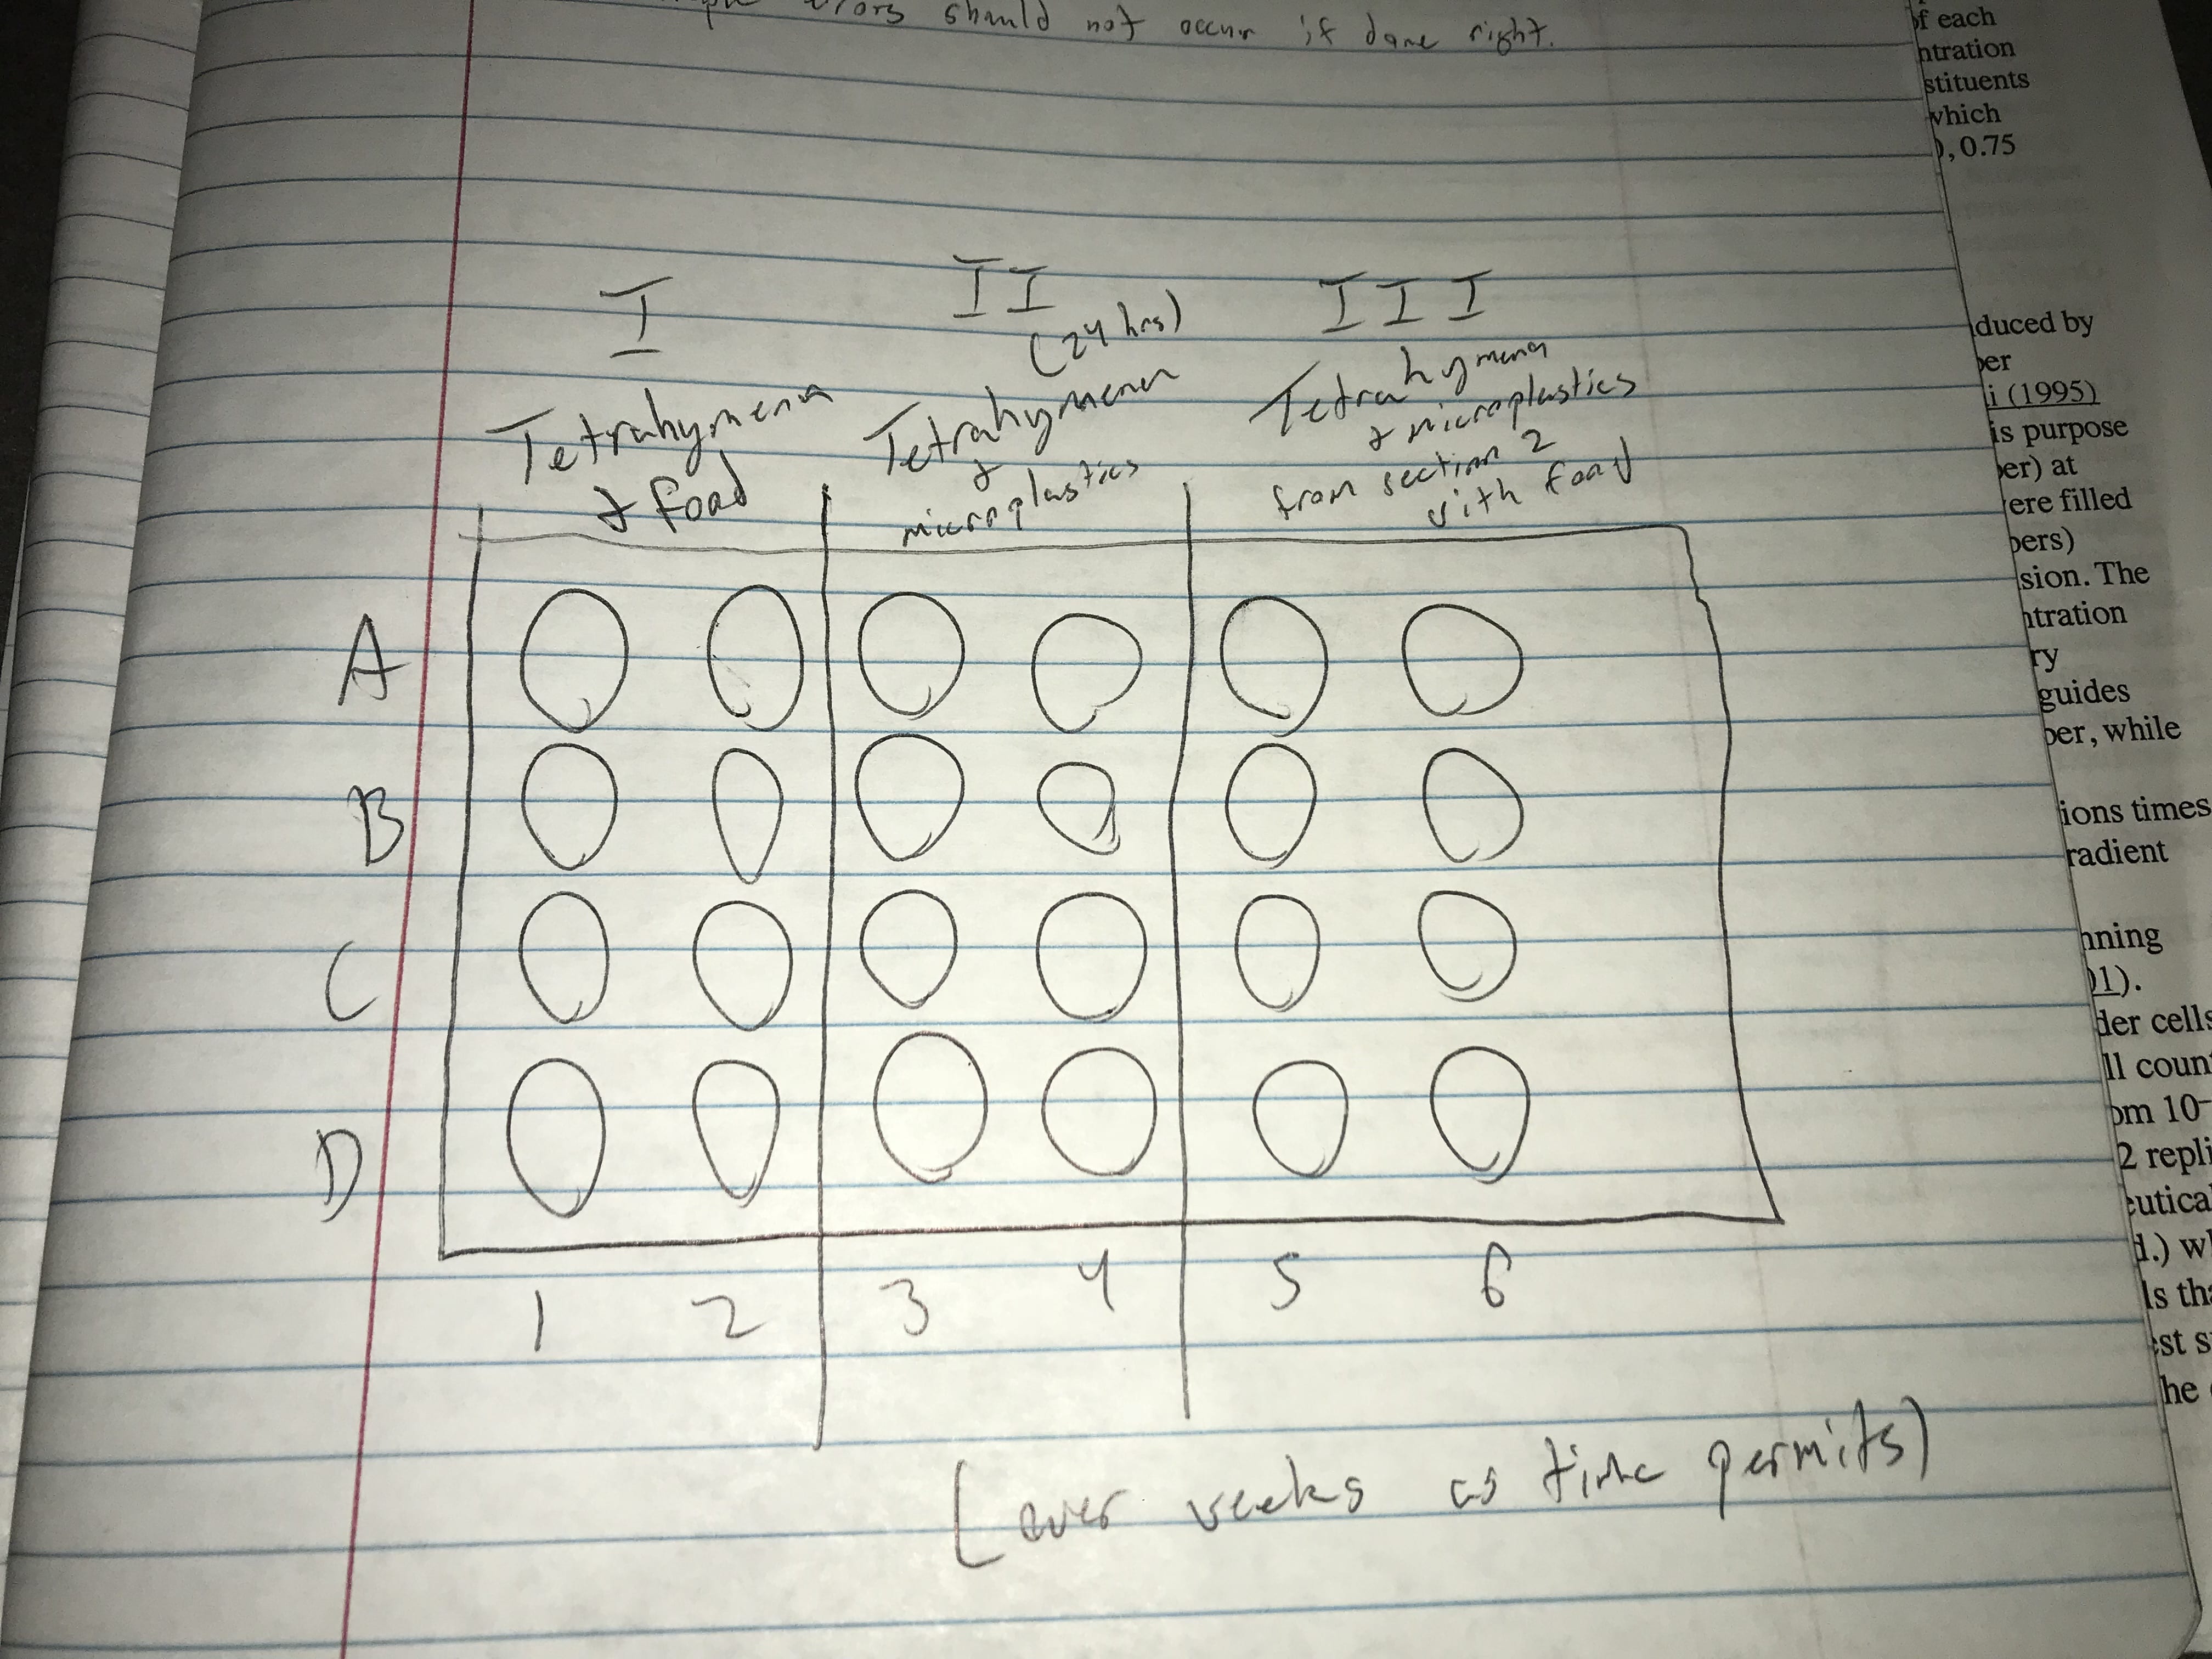
Direction Change Assay-
(One each for control and treatment solutions)
- Two per table
- 20 μl drop of either the control or treatment.
- Record the # of direction changes in 10 seconds 10 times (use a different tetrahymena each time)
- Record the data average as : [# of changes-time spent spinning]
Data:
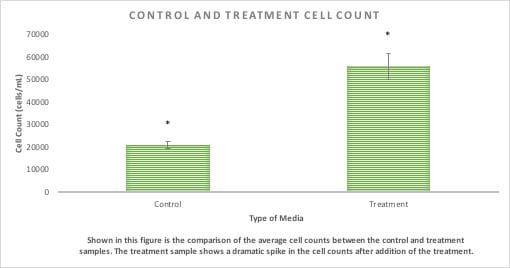
Cell Counts of 2μl Tetrahymena Drops-
Control: Average- 17 cells
| Drop # |
# of Cells |
| 1 |
16 |
| 2 |
18 |
| 3 |
17 |
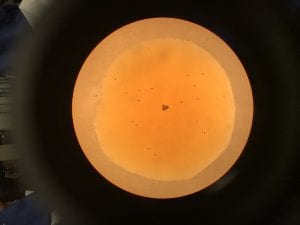
Treatment: Average- 70.66 cells
| Drop # |
# of Cells |
| 1 |
77 |
| 2 |
75 |
| 3 |
60 |

Spectrophotometers-
-Optical Density @ 600
| Sample |
Amount Absorbed |
| PPT |
0 |
| PPT + “Twine Juice” |
0.054 |
| PPT + Tetrahymena |
0.019 |
| PPT + “TJ” + Tet |
0.065 |
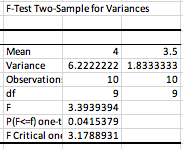
Directional Change Assay:
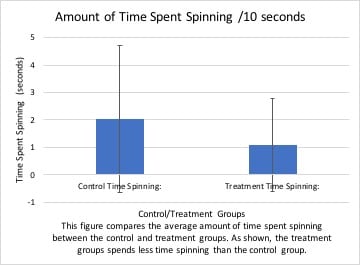
Control- Average(changes): 4, Average(time spiraling): 4.6
| Cell |
# of Direction Changes
/10 sec |
Time Spent Spiraling(sec) |
| 1 |
1 |
9 |
| 2 |
2 |
7 |
| 3 |
6 |
0 |
| 4 |
1 |
8 |
| 5 |
5 |
2 |
| 6 |
4 |
1 |
| 7 |
8 |
2 |
| 8 |
2 |
7 |
| 9 |
4 |
6 |
| 10 |
7 |
4 |
Treatment-Average(changes): 3.5, Average(spiraling): 4.75sec
| Cell . |
# of Direction Changes
/10 sec |
Time Spiraling |
| 1 |
4 |
4.5 |
| 2 |
2 |
5 |
| 3 |
3 |
2 |
| 4 |
2 |
2 |
| 5 |
3 |
8 |
| 6 |
5 |
3 |
| 7 |
2 |
7 |
| 8 |
4 |
5 |
| 9 |
6 |
9 |
| 10 |
4 |
2 |
Conclusion:
In conclusion, the lab served as, at least for me, a confidence-boosting lab. I say that because we are getting the opportunity to put to use the skills and information that we have been learning throughout the semester. Like the article that we read in the pre-lab says, science can be discouraging at times, making you feel “stupid” because you don’t know the answer. Labs like this, where we get to use our new-found skills and observations to come up with our own results brings the enjoyment and thrill of scientific research back into the “classroom”. Labs like this are what we look forward to when putting in the work to prepare for it early on, and actually conducting it just reassures students like us that the not-so-fun preparation is well worth it.
Future Steps:
We will use the information collected in this lab to continue our research experiments and include in our Scientific Research Paper. Being that the whole class essentially is doing the same experiment, our future results should be fairly accurate considering the repetition of it throughout the class. Also, by learning more about, and by writing our own Materials and Methods section for our research paper, I now have a further understanding of what a Scientific Research Paper requires. I am excited to continue learning and putting new skills to work in the lab as well as writing my own research paper based on my own research!