April 26

Lab 14: Poster Presentation and Abstract submission 04/25/19

Print Friendly, PDF & Email

Objective:

The objective of this lab was to organize the entire classes sample data through bringing together multiple aspects of the soil in a single excell spreadsheet. It was also to revise our poster, poster title, and abstract.

Purpose:

The purpose of this lab was to allow for a clearer picture of the overall results to be achieved through assimilating information together across multiple samples. It was also to spend additoinal time dedicated towards creating a better poster and abstract and to have access to the instructors for questions.

Procedure:

  1. Vote on a logo.
  2. Enter soil metadata results into the excel spreadsheet for your class.
  3. Communicate your sample ID to the instructor after identifying the remainder of your group’s extracted DNA sample.
  4. Revise your poster, poster title, and abstract while using the instructors as needed.

Data/Observations:

Due to our PCR results being negative, our metadata was taken off the spreadsheet and considered to contain no importance.

-Title-

Soil eDNA Analysis Targeting the V4 Region Using the 18S Primer

-Abstract-

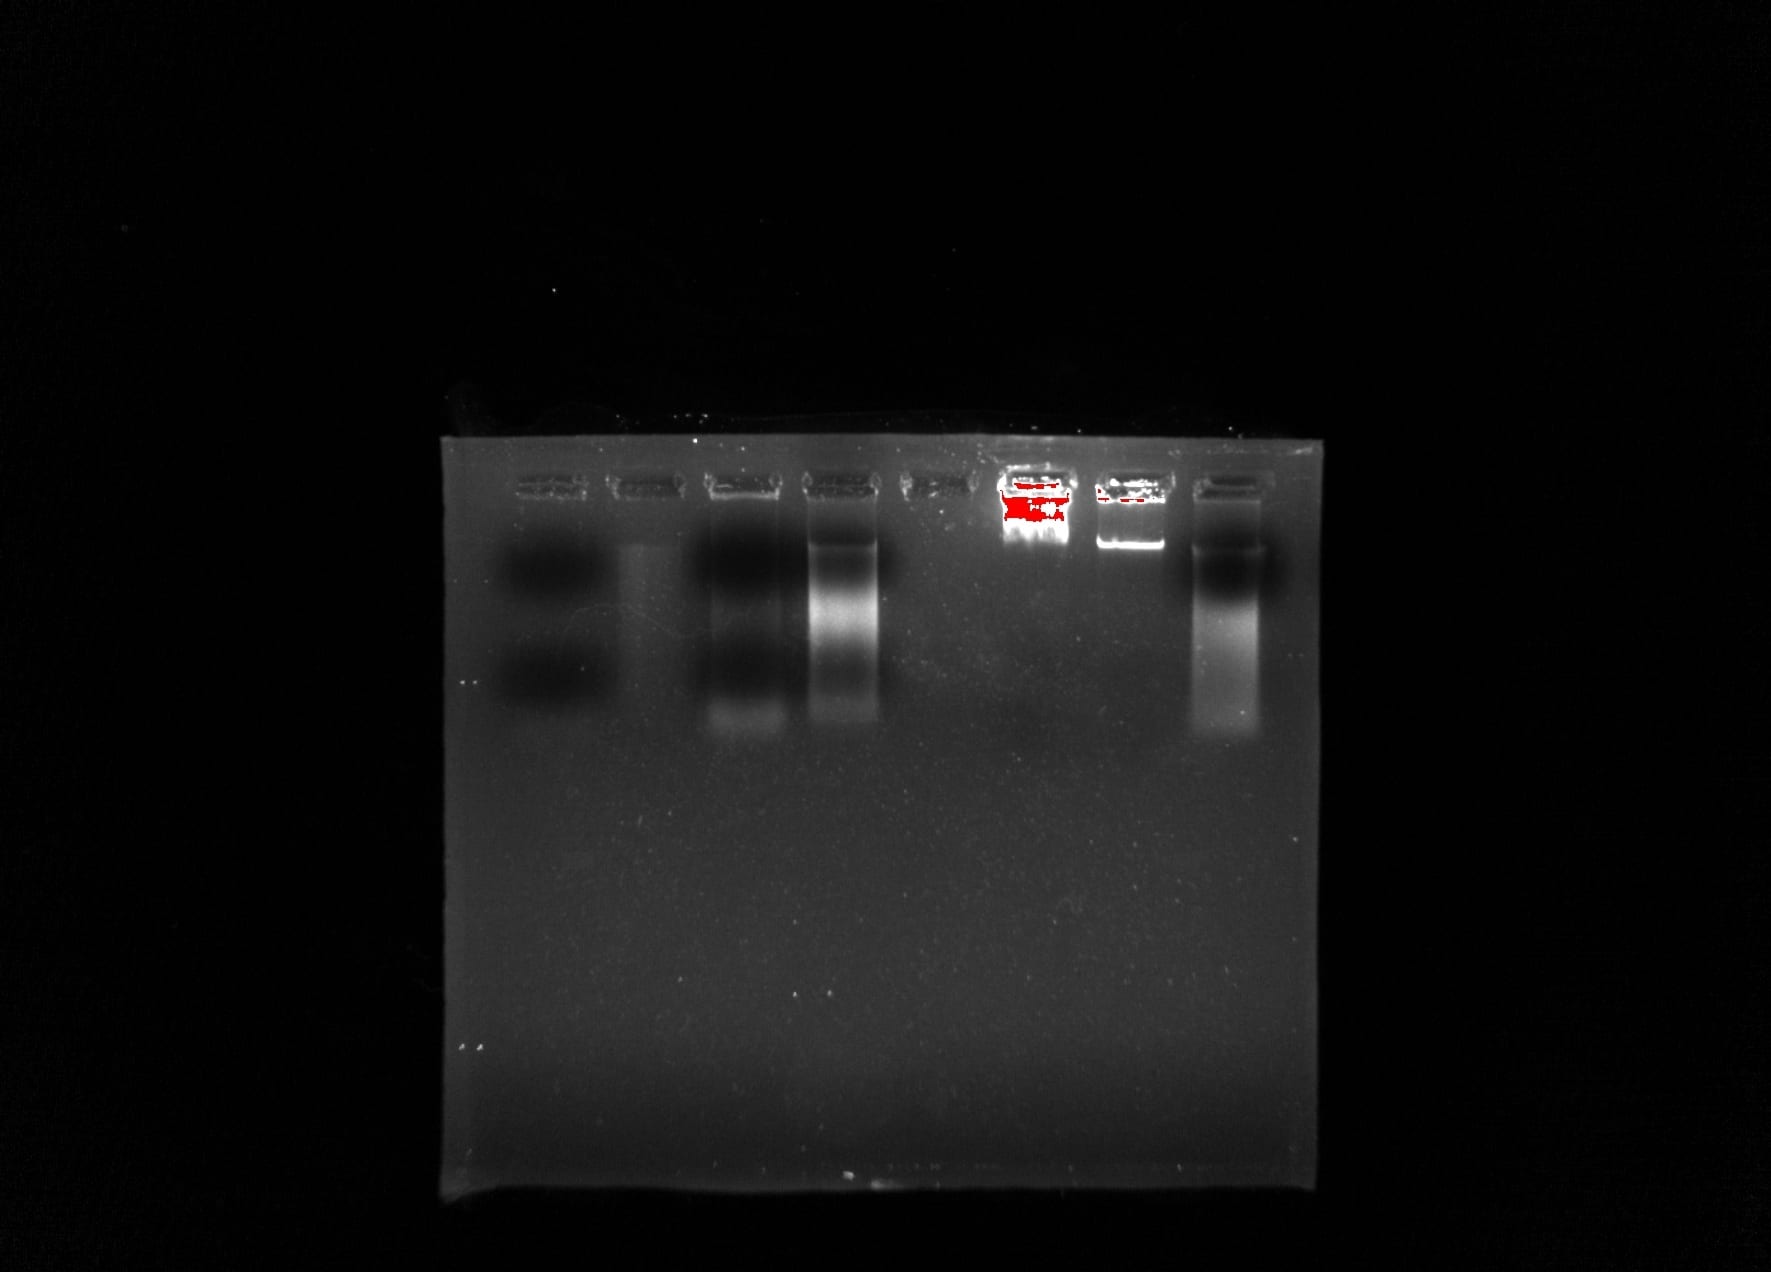
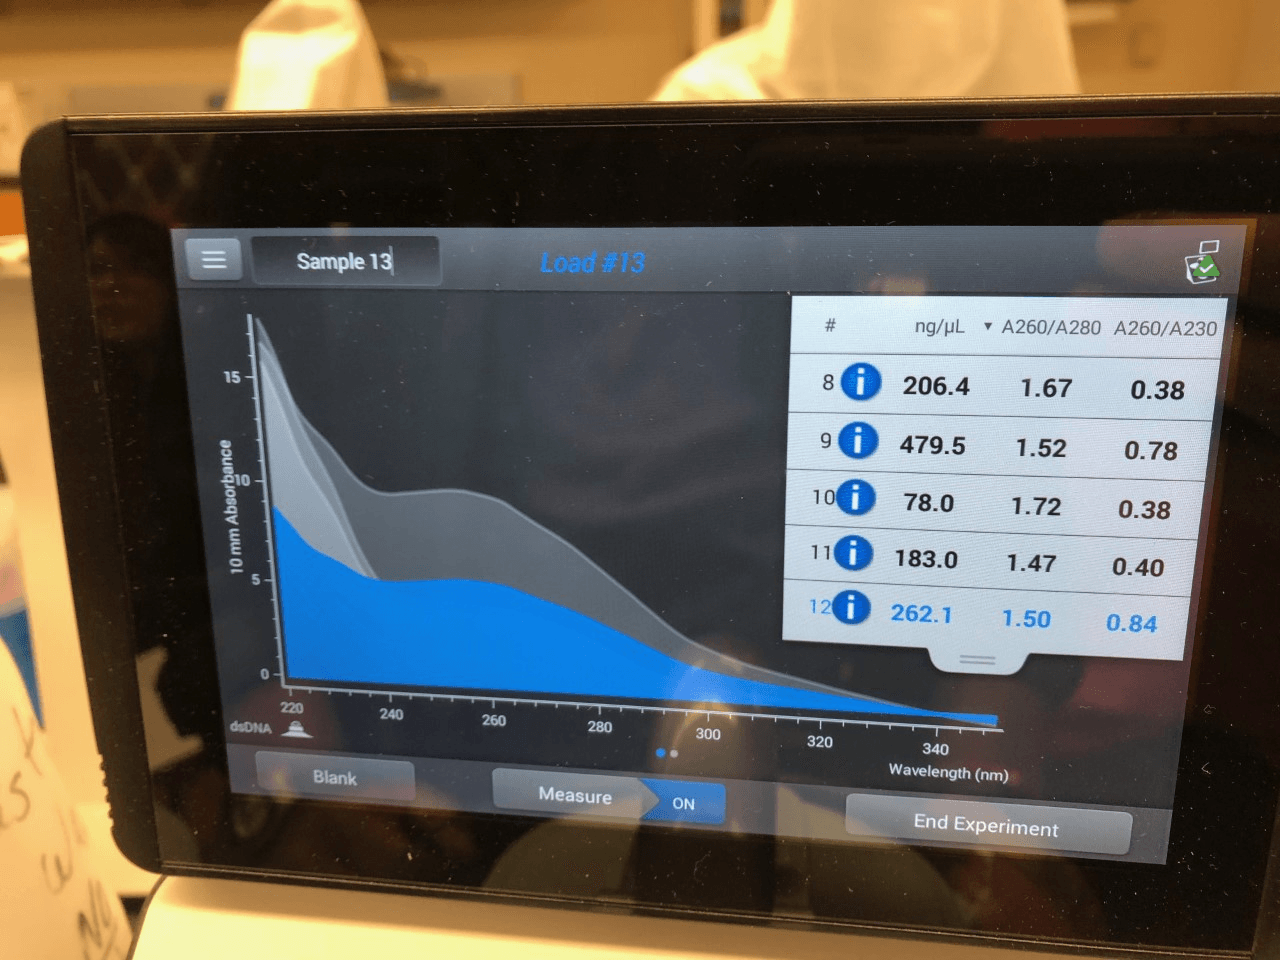
Soil ciliates are a diverse group of eukaryotes that play an important role in the environment but are understudied due to a lack of standard methods used to extract them from soil. The purpose of this experiment was to determine ciliate biodiversity in soil samples taken from the rhizosphere of Baylor trees. The protocols used were ones that have yet to be perfected in hopes of establishing them as universal method such as silica bead extraction of DNA and the chelex extraction method. DNA was extracted and purified from the soil collected using the ‘silica bead method’. The DNA concentration was obtained using a nanodrop and gel electrophoresis by running against a mass standard, and used PCR to amplify the 18s V4 region. The Polymerase Chain Reaction yielded a negative result, indicated by a ‘smear’ of DNA rather than a band. The nanodrop showed the concentration of DNA to be 262.1 ng/µl with the A260/280 to be 1.5. Despite negative results, the experiment showed the validity of results that can be found through silica bead and chelex DNA extraction; however, the lack of positive results was most likely due to an improper dilution or a degradation of DNA. Additionally, further research can be done using bioinformatics to visualize the ciliate diversity.

-Poster-

Conclusion:

In conclusion, this lab proved to be important in organizing the data across the different samples and to see which showed positive PCR results. This occurred for 10 samples and it will soon be decided which ones will be chosen go into further detail with. It also served to allow the quality of our material for the CURES symposium to be improved.

Storage:

There was no storage needed for this lab. Extracted DNA samples were relabelled and our desks were cleared to ensure it was left as it was found.

Future Goals:

In the future, I hope to conduct bioinformatics on the samples that showed positive results after PCR. After this, I hope to discover the biodiversity with the rhizophere of Baylor’s trees around campus and observe the types of ciliates within it.


April 19

Lab 13: Soil eDNA Metabarcoding Analysis: Qiime 2 04/18/19

Print Friendly, PDF & Email

Objective:

The objective of this lab was to open the Emp folder that contains fastq files and barcode files, walkthrough Qiime2 with the code for analyzing the sequencing data, collect metadata containing sample IDs and barcodes, and compare it to the Silva database of other 18S sequences.

Purpose:

The purpose of this lab was to review the skills and knowledge of Qiime2 earned through repeating the process of past labs but using our Soil eDNA instead. It was also to gather qzv files in order to visualize our data.

Procedure:

  1. Redownload Miniconda and Qiime2 onto the Mac being used.
  2. Download the folder
  3. Change directory to downloaded file in terminal
  4. Activate qiime2-2019.1.
  5. Open the file found in the powerpoint listed under Modules.
  6. Work through the file’s steps listed.
  7. View the qzv files that were created.

-File Steps-

Importing sequences as QIIME2 artifact:

qiime tools import \

–type EMPPairedEndSequences \

–input-path emp-paired-end-sequences \

–output-path emp-paired-end-sequences.qza


Demultiplexing sequences:

qiime demux emp-paired \

–m-barcodes-file sample-metadata.tsv \

–m-barcodes-column BarcodeSequence \

–i-seqs emp-paired-end-sequences.qza \

–o-per-sample-sequences demux.qza \


qiime demux summarize \

–i-data demux.qza \

–o-visualization demux.qzv


Denoising using DADA2 and creating a feature table with Representative sequences:

qiime dada2 denoise-paired \

–i-demultiplexed-seqs demux.qza \

–p-trunc-len-f 220 \

–p-trunc-len-r 220 \

–o-table table.qza \

–o-representative-sequences rep-seqs.qza \

–o-denoising-stats denoising-stats.qza


qiime feature-table summarize \

–i-table table.qza \

–o-visualization table.qzv \

–m-sample-metadata-file sample-metadata.tsv


qiime feature-table tabulate-seqs \

–i-data rep-seqs.qza \

–o-visualization rep-seqs.qzv


qiime metadata tabulate \

–m-input-file denoising-stats.qza \

–o-visualization denoising-stats.qzv


Creating a phylogenetic tree:

qiime phylogeny align-to-tree-mafft-fasttree \

–i-sequences rep-seqs.qza \

–o-alignment aligned-rep-seqs.qza \

–o-masked-alignment masked-aligned-rep-seqs.qza \

–o-tree unrooted-tree.qza \

–o-rooted-tree rooted-tree.qza


Taxonomic classification:

qiime feature-classifier classify-sklearn –i-classifier silva-132-99-515-806-nb-classifier.qza –i-reads rep-seqs.qza –o-classification taxonomy.qza


qiime metadata tabulate \

–m-input-file taxonomy.qza \

–o-visualization taxonomy.qzv


qiime taxa barplot \

–i-table table.qza \

–i-taxonomy taxonomy.qza \

–m-metadata-file sample-metadata.tsv \

–o-visualization taxa-bar-plots.qzv

Data/Observations:

Here are the graphs found throughout the Qiime2 process fo analyzing our data. The first graph shows the Quality Plot of the forward and reserve reads. The second shows the diversity of DNA found in our soil sample and the abundance of each.

Conclusion:

In conclusion, this lab proved to be very encouraging and fruitful. We finally were able to analyze the DNA from our soil and to view the diversity of organisms and ciliates found within. For example, ryegrass was the most common DNA found; however, DNA of the Cooloola monster was also found. It also showed our retention of knowledge and skills of using Qiime2.

Storage:

No storage was needed during this lab. Computers were logged off, and our desk was cleaned in order to ensure it was left as it was found.

Future Goals:

In the future, I hope to better understand our soil and to learn else lurks within the rhizosphere of Baylor’s campus. I also plan to deliver a prresentation over the process of extracting DNA in class and at the CURES symposium.


April 12

Lab 12: UNIX and Setting up the System 04/11/19

Print Friendly, PDF & Email

Objective:

The objective of this lab was to gain further understanding on what all Qiime2 can do to increase our knowledge of our soil samples. This was shown through downloading the sequences, demultiplexing the sequences, denoising the sequences, creating a feature table and barplot, and conducting taxonomic analysis.

Purpose:

The purpose of this lap was to become more familiar with terminal and to discover the possibilities that can be done with our own data. It was also a reminder form the previous lab of how to properly set up Qiime2.

Procedure:

  1. In order to re-install Qiime2, download 64-bit .pkg installer version of Miniconda.
  2. Type “conda update conda” in the terminal, and then “y”.
  3. Type “conda install wget” in the terminal, and then “y” to ensure all files are downloaded.
  4. Type “wget https://data.qiime2.org/distro/core/qiime2-2019.1-py36-osx-conda.yml
    conda env create -n qiime2-2019.1 –file qiime2-2019.1-py36-osx-conda.yml
    # OPTIONAL CLEANUP
    rm qiime2-2019.1-py36-osx-conda.yml” to allow for the cleanup process.
  5. Type ” source activate qiime2-2019.1″ to activate it Qiime2
  6. To begin the moving pictures tutorial, type “mkdir qiime2-moving-pictures-tutorial cd qiime2-moving-pictures-tutorial” to change to a new directory.
  7. Go to files within finder and click the link at the bottom with your ID in order to visualize the following steps.
  8. Type “wget \ -O “sample-metadata.tsv” \ “https://data.qiime2.org/2019.1/tutorials/moving-pictures/sample_metadata.tsv”” to download sample metadata.
  9. Type “mkdir emp-single-end-sequences.” followed by “wget \ -O “emp-single-end-sequences/barcodes.fastq.gz” \”https://data.qiime2.org/2019.1/tutorials/moving-pictures/emp-single-end-sequences/barcodes.fastq.gz”/ wget \  -O “emp-single-end-sequences/sequences.fastq.gz” \  “https://data.qiime2.org/2019.1/tutorials/moving-pictures/emp-single-end-sequences/sequences.fastq.gz”qiime tools import \  –type EMPSingleEndSequences \  –input-path emp-single-end-sequences \  –output-path emp-single-end-sequences.qza” to download the sequences.
  10. Type “qiime demux emp-single \  –i-seqs emp-single-end-sequences.qza \  –m-barcodes-file sample-metadata.tsv \  –m-barcodes-column BarcodeSequence \  –o-per-sample-sequences demux.qzaqiime demux summarize \  –i-data demux.qza \  –o-visualization demux.qzv” to demultiplex the sequences.
  11. Then drag the qzv file to Qiime2 View to observe the visualization.
  12. Type “qiime dada2 denoise-single \–i-demultiplexed-seqs demux.qza \–p-trim-left 0 \–p-trunc-len 120 \–o-representative-sequences rep-seqs-dada2.qza \–o-table table-dada2.qza \–o-denoising-stats stats-dada2.qza/ qiime metadata tabulate \  –m-input-file stats-dada2.qza \  –o-visualization stats-dada2.qzvmv rep-seqs-dada2.qza rep-seqs.qzamv table-dada2.qza table.qza” to denoise the sequences.
  13. Then drag the DADA2 qzv file to Qiime2 View to observe the visualization.
  14. Type “qiime feature-table summarize \–i-table table.qza \–o-visualization table.qzv \–m-sample-metadata-file sample-metadata.tsvqiime feature-table tabulate-seqs \–i-data rep-seqs.qza \–o-visualization rep-seqs.qzv” to create the feature table.
  15. Then drag the newly made qzv file to Qiime2 View to observe the visualization.
  16. Type “wget \  -O “gg-13-8-99-515-806-nb-classifier.qza” \  “https://data.qiime2.org/2019.1/common/gg-13-8-99-515-806-nb-classifier.qza”qiime feature-classifier classify-sklearn \  –i-classifier gg-13-8-99-515-806-nb-classifier.qza \  –i-reads rep-seqs.qza \  –o-classification taxonomy.qza qiime metadata tabulate \  –m-input-file taxonomy.qza \  –o-visualization taxonomy.qzv” to use taxonomic analysis.
  17. Then drag the taxonomy qzv file to Qiime2 View to observe the visualization.
  18. Type “qiime taxa barplot \  –i-table table.qza \  –i-taxonomy taxonomy.qza \  –m-metadata-file sample-metadata.tsv \  –o-visualization taxa-bar-plots.qzv” to create the taxa barplot.
  19. Then drag the taxa barplot qzv file to Qiime2 View to observe the visualization.

Data/Observations:

Sample ID Location of Sample Year Month Day Soil Texture pH Percent Water Content Extraction Method ng/μL A260/280 A260/A230
MAC Quercus Virginiana next to Moody Library 2019 January 23 Clay Loam 6.5 35.05% Soil 262.1 1.50 0.84

There was no new data collected. Only a combination of old data was made into the above table. An example of possibilities with Qiime2 was observed but nothing to do with our soil samples.

Conclusion:

In conclusion, this week proved to be very illuminating into the possibilities of Qiime2 and how the files created can be viewed through graphs and tables. Some of the things learned include how to download the sequences, demultiplex the sequences, denoise the sequences, create a feature table and barplot, and conduct taxonomic analysis of my soil sample

Storage:

No storage was needed this week as we were in the computer lab. The computer was shut off and our stuff taken so as to leave the desk as it was found.

Future Goals:

In the future, I hope to utilize my knowledge gained from this week’s lab to reach a new level of understanding with the soil collected from the rhizosphere of Baylor’s trees. I will seek to achieve this by downloading the sequences, demultiplexing the sequences, denoising the sequences, creating a feature table and barplot, and conducting taxonomic analysis of my soil sample.

April 5

Lab 11: Poster Presentations (SW) Cloud Computing and Jupyter Notebooks 04/04/2019

Print Friendly, PDF & Email

Objective:

The objective of this lab was to first critique a poster and it’s abstract while the presenter was present and to be introduced to terminal the possibilities it contains within it. It was also to get Qiime2 set up on a computer with Miniconda.

Purpose:

The purpose of this lab was to further our understanding on poster presentation by viewing one in action and deciding how the abstract and poster presentation could have been better. It was also to learn the ropes of terminal and to become introduced to Qiime2 and Miniconda.

Procedure:

  1. Open terminal on a Apple computer
  2. Learn some basic commands
  3. Download “64-bit Miniconda.pkg”
  4. When finished, close terminal and reopen it.
  5. Type “conda update conda”, press return and “y”, and allow it finish running.
  6. Type “conda install wget”, press return and “y”, and allow it to finish running.
  7. Type “wget https://data.qiime2.org/distro/core/qiime2-2019.1-py36-osx-conda.yml conda env create -n qiime2-2019.1 -file qiime2-2019.1-py36-osx-conda.yml”, press return, and give it multiple minutes to finish running.
  8. Type “source activate qiime2-2019.1”, press return, and allow it to finish running.
  9. Finish the QTM.

Data/Observations:

Here are some of the list of commands learned this week:

“say (words you want to say)” allows for the computer to say what is typed

“Is” is the list of files

“cd desktop” allows you to look through directory

“conda update conda” to update Miniconda

“y” for yes

“n” for no

Conclusion:

In conclusion, this lab proved to be very impactful in understanding terminal and learning about Qiime2 and Miniconda. It also  allowed us to learn more from examples of people during their poster presentation and how they wrote their abstract. We successfully installed activated Miniconda and become familiar with basic commands.

Storage:

No storage was needed for this lab. Computers were turned off when finished.

Future Goals:

In the future, I plan to become more familiar with terminal and to learn more advanced commands that can be used. I also hope to present my poster and be excellent through learning form the strengths and weaknesses of other groups. I also hope to use Qiime2 and Miniconda and understand more fully what all can be accomplished with them.

March 29

Lab 10: Next Generation Sequencing and Metabarcoding 03/28/19

Print Friendly, PDF & Email

Objective:

The objective of this lab was to become familiar with Next Generation Sequencing and Metabarcoding through the Illumina Card Challenge, to display our knowledge through completing the QTM, and to become introduced to Cyverse.

Purpose:

The purpose of this lab was to prepare our group for the next portion of labs focused on sequencing of DNA and metabarcoding. This accomplished through the QTM and card challenge.

Procedure:

  1. The powerpoint will be presented with an introduction over the material for the lab.
  2. Complete the Illumina Card Challenge.
  3. Complete the QTM.
  4. Turn in ziplock bag containing the parts to the challenge and the QTM before leaving.

Data/Observations:

There was no data or observation gathered during this lab.

Conclusion:

In conclusion, this lab  proved to be very informational and beneficial in gaining new information about the process of sequencing. It included steps of tagmentation, bridge amplification, cluster formation, and chain termination within sequencing. We also created Cyverse accounts and learned about the great opportunities available to our group within Cloud Computing.

Storage:

The computers were turned off and all QTMs and ziplock bags with turned in.

Future Goals:

In the future, I hope to conduct metabarcoding and sequencing with the DNA gathered from the rhizosphere of one of Baylor’s trees. I also hope to present the information in our updated poster to show the knowledge gained throughout this semester.

March 22

Lab 9: Poster Presentations 03/21/19

Print Friendly, PDF & Email

Objective:

The objective of this lab was to present the rough draft of our scientific poster and receive feedback as we give feedback to the rest of the groups. We then paired with another group to increase the amount of feedback received.

Purpose:

The purpose of this lab was to highlight the importance of reviewing each other’s poster to point out ways to improve that the original group may have not realized. It was also to give us time to implement the feedback before the lab ended.

Procedure:

  1. Pull up the rough draft of your scientific poster.
  2. Review each group’s scientific poster on its inclusion of the scientific method, the central issue identified, the organization, the evidence’s support of the main claim, the conclusions drawn, and the presentation.
  3. Present your poster when it is your turn.
  4. Meet with another group after all the presentations and give each other further feedback while examining the poster.
  5. Implement the feedback received after the presentations.

Data/Observation:

No data was collected during this lab; however, feedback was observed and given to increase the quality of my group’s scientific poster.

Conclusion:

In conclusion, valuable feedback was received during lab. Reviewing one another’s poster served to shed light in ways to make things better and remove things that are repetitive. For example, our objectives were too similar to our methods section and can be combined. We also found a better way to word our title  and better organize the poster to allow it to be easier to understand in order to more appealing to the eye.

Storage:

Since it occurred in the computer lab, there was no need to store anything.

Future Goals:

In the future, I plan to revise my group’s scientific poster and incorporate all the feedback received to allow the poster to be best improved for the final presentation and symposium. I hope to make the information as succinct as possible and incorporate more charts to best show the information gathered during the experiment.

March 8

Lab 8: PCR Results; Scientific Poster Design 03/07/19

Print Friendly, PDF & Email

Objective:

The objective of this lab was perform gel electrophoresis in order to determine the results from PCR  and to see if it could be sent off to be sequenced. It was also to take the midterm and create the rough of the scientific poster to eventually be presented.

Purpose:

The purpose of this lab was to gain further experience working with gels and to determine the ability of our DNA samples for sequencing. It was also to test our knowledge gained over the last year within lab and to see how much has been retained.  It was also to transfer our ideas from writing protocols to creating a scientific poster to better communicate our experiment conducted and results.

Procedure:

  1. Get a pre-prepared 1.5% agarose gel.
  2. Obtain a 1kb ladder, as well as your DNA treatment and control samples.
  3. Place gel in electrophoresis chamber with the wells facing the black (negative) end and cover the gel with 1X TAE loading buffer.
  4. Place 5μL of 1kb ladder into the first well.
  5. Place 10μL of your DNA treatment tube into the appropriate well according to the other groups.
  6. Place 10μL of your control tube into the next well.
  7. Record what is in each well of your gel.
  8. Put the lid on top of the chamber and attach the wires.
  9. Let the gel electrophoresis run for 30 minutes at 100v.
  10. Take the midterm in the computer lab.
  11. Prepare the rough draft of your scientific poster.

Data/Observations:

This is the rough draft of our scientific poster.

This is the results of gel electrophoresis with our DNA treatment sample in well 2 and our control in well 3.

Well order
1. 1kb ladder

2. MAC

3. MAC control

4. GD

5. GD control

6. CJ

7. CJ control

8. EMPTY

Conclusion:

In conclusion, our lab appeared to be successful initially with the DNA seen in well 2; however, our instructor expressed that it was a “smear” and that we could not really gather any information from it. We may run it again to see if there was a mistake somewhere but will most likely just explain what could have been the reasons behind it when we present our scientific poster. The rough draft of our scientific foster was created during and after lab. The midterm was also taken in order to express some of the information that has been retained within the last year.

Storage:

The gels were discarded, the treatment sample, control sample, and 1kb ladder returned, and our desk was cleaned and left how it was found.

Future Goals:

In the future, if PCR is conducted again, then I hope to get a sample that does not provide a “smear” of DNA that does provide any information. I also plan to best and most accurately display our methods, results, conclusion, and other information about our experiment in a scientific poster and present it.


March 1

Lab 7: PCR Amplication of DNA 02/28/19

Print Friendly, PDF & Email

Objective:

The objective of this lab was to put our knowledge of aseptic techniques to use, better understand PCR, including the steps and primers used, and to prepare samples for PCR analysis. It was also to create a rough draft of a poster to display the experiment conducted throughout this semester.

Purpose:

The purpose of this lab was to minimize contamination and review basic calculation and pipetting skills while ensuring our samples were prepared to conduct PCR for the upcoming lab. It also served as a time to begin discussing the best way to present the results found our DNA sequencing.

Procedure:

  1. Clean the work station with bleach to ensure it is disinfected and contamination is minimized.
  2. Prepare your DNA sample to be between 10-100ng. If it is larger than 100ng, conduct a dilution to allow it to be between the range.
  3. Put your water, Taq polymerase, soil DNA, primers, and tubes for your samples into an ice bath.
  4. In order to prepare a 25µL control sample, add 12.5 µL of Taq polymerase, 1 µL of 10µM primer mix, and 11.5µL of water to the sample.
  5. In order to prepare a 25µL soil DNA sample, add 12.5 µL of Taq polymerase, 1 µL of 10µM primer mix, 3.8µL of DNA template, and 7.7µL of water.
  6. Label both tubes.
  7. Place the samples within the tube holder and mark their location on the paper next to it.
  8. Complete the QTM including a rough draft of the poster to be created and presented.

Data/Observation:

Component Volume (Control Tube) Volume (Soil DNA Tube)
2X Master mix 12.5µL 12.5µL
DNA template 0µL 3.8µL
Primers (10µM) 1µL 1µL
Water 11.5µL 7.7µL
Total Volume 25µL 25µL

Our soil DNA tube and control tube were placed in the A5 and A6, respectively.

Conclusion:

In conclusion, this lab proved to be successful in preparing for the PCR analysis to occur as well as increase my group’s knowledge of PCR displayed in the Kahoot conducted. It also served to provide valuable time in order to create the rough draft of the poster to be presented later in the semester.

Storage:

Both tubes were placed within the test tube holder, the soil DNA, water, and primers were placed within the cooler, and the desk was cleaned to ensure it was left the same way it was found.

Future Goals:

In the future, I plan to conduct PCR analysis and sequence the DNA. I also hope to present a poster that best represents the information gained within the experiment conducted this semester and prepare for the midterm in the upcoming week.

February 21

Lab 6: Gel Electrophoresis and DNA Analysis 01/21/19

Print Friendly, PDF & Email

Objective:

The objective of this lab was to view the amount of DNA present. This was observed through finishing gel electrophoresis and viewing in UV light. Our purified DNA absorbance was also observed using the NanoDrop.

Purpose:

The purpose of this lab was to continue the protocol form the previous lab and finish preparing the DNA to be seen. The solidified mold was filled with the purified DNA along with buffers and taken to be viewed using special equipment.

Procedure:

  1. To begin, place your gel within the current orientation of the buffer chamber, cover it with 1X TAE, and remove the comb.
  2. Mix 9µL of the DNA sample with 1µL of 10X loading buffer into a microfuge tube and spin it.
  3. Place the 10µL sample into the first lane of the gel.
  4. Place all subsequent 10µL samples from your group in different lanes.
  5. Place 5µL of a small DNA Mass STD
  6. Place 5µL of a larger DNA Mass STD
  7. Once it is prepared, run the gel at 100v for 20 minutes.
  8. Bring the gel to an imaging lab and place the gel on the tray provided by the instructor.
  9. Capture a picture of the DNA bands through using the CCD camera-based system.
  10. Place your purified DNA in the NanoDrop in order to measure the absorbance level and the difference ratio between protein and DNA within the sample.

Data/Observation:

We discovered that our soil sample had in fact contained a large amount of DNA compared to other DNA samples within the class.

The results of our DNA are captured within these photos. My DNA sample is in the most right lane in the first two pictures and the information in the blue for the third picture.

NanoDrop results 

ng/µL – 262.1

A260/A280 – 1.50

A260/A230 – .84

Conclusion:

In conclusion, this lab was very exciting and fulfilling as it allowed us to get a glimpse of how our hardwork was paying off. We prepared our DNA in the mold for electrophoresis and viewed the amount of protein to DNA ratio as well as how dense the gathered DNA was.

Storage:

The mold and purified DNA were stored according to the direction of the instructors. The desk was cleaned, the equipment was turned off, and our station was left as it was found.

Future Goals:

In the future, I hope to create a PCR reaction and amplify the DNA through sequencing. This would allow for maximizing our extracted and purified DNA to gather results to see how diverse the spoil was collected from is.

February 15

Lab 5: DNA Extraction Part 2 02/14/19

Print Friendly, PDF & Email

Objective:

The objective of this lab was to purify the DNA extracted from our soil samples in the previous week. It was also to create the gel used in gel electrophoresis.

Purpose:

The purpose of this lab was to continue the procedure from previous lab and begin a step that will be finished in the subsequent lab. This was accomplished through using the protocol to purify the extracted DNA as well as preparing for gel electrophoresis by making the gel.

Procedure:

DNA Extraction

  1. Add the “crude soil DNA” to a 15mL tube.
  2. Add 2mL of warm DNA resin at 37 ° C to the tube.
  3. Set up the column and syringe barrel and place it onto the vacuum.
  4. Add 6mL of 80% isopropanol to the barrel.
  5. Put the column in a 1.5mL tube and spin at 8000g for 5 minutes.
  6. Place the tube into a heating block at 80 ° C for 45 seconds.
  7. Put the column into a new 1.5mL tube and add 50μL of sterilized water heated at 80 ° C to the tube. 
  8. Incubate the tube for 1 minute.
  9. Following incubation, spin the tube at 8000g at one and half minutes.
  10. Then remove the column and store the 1.5mL tube with the purified DNA inside.

Gel Electrophoresis

  1. Add 4ml of 10x TAE stock solution, 36ml D.I. water and 0.4g agarose powder to a Erlenmeyer flask.
  2. Microwave the solution for 1 minute.
  3. After heating, the swirl the solution for 1 minute.
  4. Have the instructor add 2μL of Ethidium Bromide and continue to swirl.
  5. Create the mold for the gel.
  6. Once the flask is hot enough to hold, the pour the solution into the mold with an inserted comb.
  7. Once the mold solidifies, remove the inserted comb with care.

Data/Observations:

No data or observations were gathered from this lab. The purified DNA was the result of the first procedure and the gel being made ready for gel electrophoresis was the result of the second procedure.

Conclusion:

In conclusion, this lab proved to be beneficial in learning the techniques associated with extraction and purifying DNA as well as making the gel to allow for the DNA fragments to be viewed in bands. My group was successful in completing both procedures.

Storage:

The gel and purified DNA was stored in the freezer as designated by the instructors. The leftover tubes were discarded and the desk was cleaned and left as it was found.

Future Goals:

In the future, I hope to learn the results of the extracted and purified DNA and be able to view the DNA fragments following gel electrophoresis. I hope to conduct bioinformatics to best understand the result of the experiment.