April 25

Lab 14 – Final Poster and Abstact

Print Friendly, PDF & Email

4/25/19

Objectives/Goals: The objective of this lab was to tie all of the loose ends by voting on a logo, creating an abstract, finalizing the posters, and uploading our metadata to a class excel file.

Procedure:

  1. Vote on lab logo
  2. Upload metadata to class excel file
  3. Write and submit abstract to box files
  4. Fix poster according to Dr. Adair’s canvas comments
  5. Upload final poster to box files
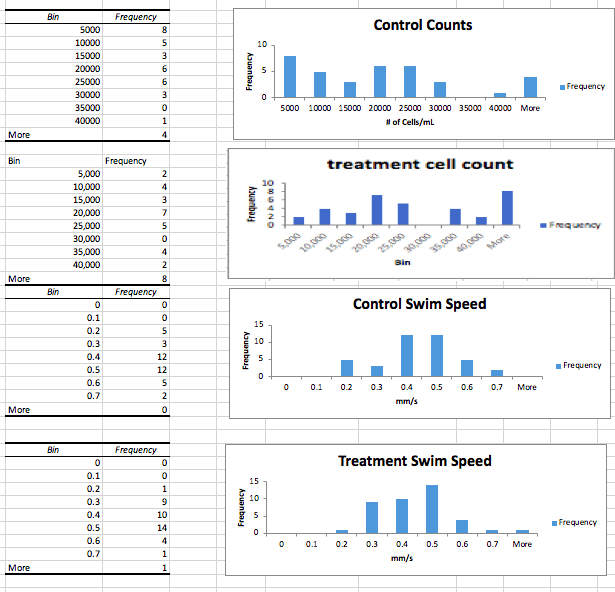
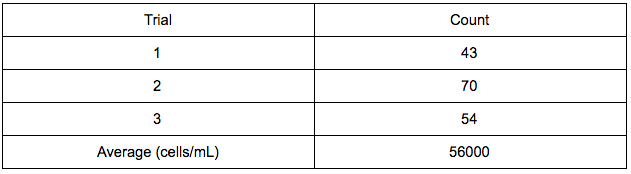
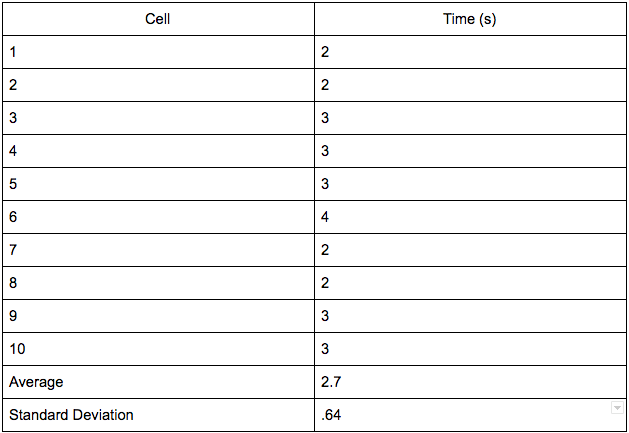
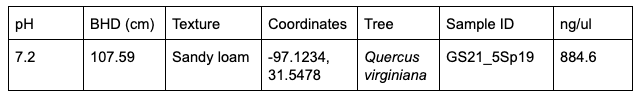
Data:

Abstract (1) (1)-257osha

Conclusions/Future Goals: Overall this lab went smoothly because it was mostly doing touch ups on the poster and uploading files to the Box. Our poster has all of the necessary data, and our abstract accurately and briefly summarizes our experiment. In the future, I hope that I can conduct an experiment and efficiently make a scientific poster to communicate my findings and why they are important.

April 18

Lab 13 – Soil eDNA Metabarcoding Analysis

Print Friendly, PDF & Email

4/18/19

Objectives/Goals: The objective of this lab was to learn how to effectively perform metabarcoding analysis. We did this by using sample data from an eDNA sample extracted from soil associated with the rhizosphere of Bermuda grass from the Blackland Prairie Soil, and running the data through qiime2 to get the taxonomic qzv. files to visualize and analyze.

Procedure:

  1. Open terminal
  2. Activate qiime2 [source activate qiime2-2019.]
  3. Download box files
  4. Make the directory for the files [cd /Users/sophiashaikh/Documents/CILICURE_2018]
  5. Import the sequences as a qiime2 artifact [qiime tools import \–type EMPPairedEndSequences \–input-path emp-paired-end-sequences \–output-path emp-paired-end-sequences.qza]
  6. Demultiplex the sequences to align the data [qiime demux emp-paired \–m-barcodes-file sample-metadata.tsv \–m-barcodes-column BarcodeSequence \–i-seqs emp-paired-end-sequences.qza \–o-per-sample-sequences demux.qza \qiime demux summarize \–i-data demux.qza \–o-visualization demux.qzv]
  7. Denoise the data with DADA2 to get rid of low quality sequences and create a feature table with representative sequences  [qiime dada2 denoise-paired \–i-demultiplexed-seqs demux.qza \–p-trunc-len-f 220 \–p-trunc-len-r 220 \–o-table table.qza \–o-representative-sequences rep-seqs.qza \–o-denoising-stats denoising-stats.qzaqiime feature-table summarize \–i-table table.qza \–o-visualization table.qzv \–m-sample-metadata-file sample-metadata.tsvqiime feature-table tabulate-seqs \–i-data rep-seqs.qza \–o-visualization rep-seqs.qzvqiime metadata tabulate \–m-input-file denoising-stats.qza \–o-visualization denoising-stats.qzv]
  8. Create a phylogenetic tree [qiime phylogeny align-to-tree-mafft-fasttree \–i-sequences rep-seqs.qza \–o-alignment aligned-rep-seqs.qza \–o-masked-alignment masked-aligned-rep-seqs.qza \–o-tree unrooted-tree.qza \–o-rooted-tree rooted-tree.qza]
  9. Get the taxonomic classification [qiime feature-classifier classify-sklearn –i-classifier silva-132-99-515-806-nb-classifier.qza –i-reads rep-seqs.qza –o-classification taxonomy.qzaqiime metadata tabulate \–m-input-file taxonomy.qza \–o-visualization taxonomy.qzvqiime taxa barplot \–i-table table.qza \–i-taxonomy taxonomy.qza \–m-metadata-file sample-metadata.tsv \–o-visualization taxa-bar-plots.qzv]
  10. Drag the taxanomic qzv. file into the qiime2 viewer and analyze the eDNA


Data: 

Analysis: The Chelex sample has a high amount of chromodorea DNA, a type of roundworm; the Powersoil sample, however, largely consists of the flowering plants, Poales. The Chelex seems to have a high abundance of nematodes and ciliates, but the Powersoil sample has a high abundance of plant material and amoebas.

Conclusion/Future Goals: It seems like I am getting the hang of using the terminal commands, and I can tell that I’m not struggling as much as I did the first lab we used the terminal/qiime2. I was able to look at the taxonomic bar graphs and determine the abundance and diversity of the sample. In the future, I would like to be able to use the common commands without having to refer to a guide at all. I would also like to use these processes with future research.


April 12

Lab 12 – Moving Pictures

Print Friendly, PDF & Email

4/12/19

Objectives/Goals: The objective of this lab was to practice computing data, so that we can later use the same method on our own data. The goals were to make a directory, obtain the sample data, demultiplexing the data, controlling the quality of the data, visualizing a table, and diversity analysis.

Procedure:

  1. Open terminal
  2. Make a directory (mkdir qiime2-moving-pictures-tutorial cd qiime2-moving-pictures-tutorial)
  3. Open sample data (wget \-O “sample-metadata.tsv” \”https://data.qiime2.org/2019.1/tutorials/moving-pictures/sample_metadata.tsv”)
  4. Make a new directory (mkdir emp-single-end-sequences)
  5. Demultiplex the sequences (qiime demux emp-single \
    –i-seqs emp-single-end-sequences.qza \
    –m-barcodes-file sample-metadata.tsv \
    –m-barcodes-column BarcodeSequence \
    –o-per-sample-sequences demux.qza)
  6. Make a file that can be visualized (qiime demux summarize \
    –i-data demux.qza \
    –o-visualization demux.qzv)
  7. Open QIIME2view and drag file into viewer
  8. Use DADA2 method for quality control (qiime dada2 denoise-single \
    –i-demultiplexed-seqs demux.qza \
    –p-trim-left 0 \
    –p-trunc-len 120 \
    –o-representative-sequences rep-seqs-dada2.qza \
    –o-table table-dada2.qza \
    –o-denoising-stats stats-dada2.qza)
  9. Make a feature table and visualize (qiime feature-table summarize \
    –i-table table.qza \
    –o-visualization table.qzv \
    –m-sample-metadata-file sample-metadata.tsv
    qiime feature-table tabulate-seqs \
    –i-data rep-seqs.qza \
    –o-visualization rep-seqs.qzv)
  10. Visualize phylogeny (qiime diversity core-metrics-phylogenetic \
    –i-phylogeny rooted-tree.qza \
    –i-table table.qza \
    –p-sampling-depth 1109 \
    –m-metadata-file sample-metadata.tsv \
    –output-dir core-metrics-results)

Conclusion/Future Goals: This lab taught me a lot about the complex processes of bioinformatics. I learned that the terminal can be used with many different commands to make directories, save files, make files compatible for visualization, and a lot more. These commands are very useful in analyzing the diversity of samples. In the future, I hope to be able to use these commands and remember the processes without having to refer to the tutorials. I think these skills will help me in my future research when analyzing bioinformatics.

April 4

Lab 11 – Bioinformatics

Print Friendly, PDF & Email

4/4/19

Objectives/Goals: The objective of this lab was to learn how the components of bioinformatics will allow us to analyze data. The goals were to become familiar with the terminal, and download QIIME 2.

Procedure: 

  1. Install Miniconda for Mac OS
  2. Install QIIME 2 within the conda environment [wget https://data.qiime2.org/distro/core/qiime2-2019.1-py36-osx-conda.yml conda env create -n qiime2-2019.1 –file qiime2-2019.1-py36-osx-conda.yml]
  3. Activate the conda environment [activate qiime2-2019.1]
  4. Test the installation [qiime –help]

What I Learned: I learned that bioinformatics is much more complex than I previously thought. I discovered that many steps that have to be taken after getting the raw sequences. The demultiplex of barcoded information must be denoised to get rid of all the unclear/damaged data. Feature tables are then used to get a visual representation of the data. The last few steps are to actually use the resources from the bioinformatic process to determine the taxonomy and phylogeny of the sample. I also learned that computers have a terminal that allows you put in an order/shortcut to perform many tasks (downloading a software, making a folder, etc.).

Conclusion/Future Goals: Bioinformatics is a vital part of determining the diversity of our sample. I am glad that I learned about this process because I am sure that it will help me in future research. In the near future, I would like to be able to utilize the terminal without having to refer to the shortcuts to type in. I look forward to the next labs when we will be utilizing QIIME 2 to analyze our data sample.

March 22

Lab 9: Poster Presentation

Print Friendly, PDF & Email

3/21/19

Objective/Goal: The objective of this lab was to present our scientific poster presentations with the goal of obtaining feedback from Dr. Adair, Michael, Taylor, and our peers.

Feedback/Criticism: The majority of the feedback was focused around the organization of the “Methods and Materials” section; rather than have a bulky paragraph, it was recommended that my group add a simple flowchart instead. Another point if improvement was the title, because our poster’s title was not specific enough to our research. The explanation of the results section had error regarding the 1 Kb ladder for our gels as well. My group was also recommended to delete the picture of the found ciliate because it was not a high quality picture. However, Dr. Adair mentioned that she liked the collage of our metadata pictures because it was “interesting.”

Solutions/Future Goals: My lab partner and I will incorporate all the feedback we received into our poster by condensing the “Methods” section into a simple flowchart, creating a specific and relevant title, correcting our results portion, and deleting the low quality ciliate picture. Overall, I think our poster was on the right track and with these improvements it will be great.

March 8

Lab 8: PCR and Poster Design

Print Friendly, PDF & Email

3/8/19

Objectives/Goals: The objectives of this lab was to run the DNA samples using gel electrophoresis and get a rough draft of our scientific poster design. The goals were to decide whether the DNA sample was adequate enough to send for PCR and learn about the components of a scientific poster.

Materials:  Gel electrophoresis apparatus, experimental and control DNA samples, DNA ladder, micropipettor

Procedure:

  1. Obtain 1.5% agarose gel
  2. Load PCR sample and control into gel
  3. Load kb ladder (10 µl) in gel
  4. Run gel at 100V for 30 minutes
  5. View results of gel with gel imagery

Data:

Results: A high concentration with a strong degree of brightness was shown from running the gels, which indicates that there was an adequate amount of DNA in the sample.

Storage: The gels were left to be disposed of, the micropipettes were hung up, and the tabletop was wiped down.

Conclusion/Future Goals: Overall, the DNA shown from the gel electrophoresis was concentrated and a design for the scientific poster was made into a rough draft. In the future, I hope to extract an even purer source of DNA to be sequenced through the PCR technique.


February 28

Lab 7: PCR Setup

Print Friendly, PDF & Email

2/28/19

Sophia Shaikh

Objectives/Goals: The objectives of this lab were to learn about V4 ribosomal primers, PCR, and scientific poster design. The goals of the lab were to prepare our DNA tube and the control tube with the Master Mix and primer to be run through the PCR process.

Materials: Micropipettor, 2 new tubes, V4 primer, Master Mix, sterile water, small ice tub

Procedure: 

PCR Preparation

  1. Complete necessary calculations to perform PCR assay in 25 μl of reaction mixture
  2. Put on gloves and wipe down work area with bleach to prevent contamination of DNA sample
  3. Obtain materials
  4. Perform 1:10 dilution on DNA sample because my group had a large amount of DNA (884.6 ng/μl)
  5. Pipet 1 μl of diluted sample into new tube *while changing pipet tip each time*
  6. Pipet 12.5 μl Master Mix into tube with diluted sample
  7. Pipet 10.5 μl water into tube
  8. Repeat in a control tube with all components except DNA sample

Data:

Observations: This lab was not very experimental because we only prepared the tubes for PCR, so there were no observations.

Storage: The PCR tubes were put in the block with all of the other groups, the other tubes were kept on ice in the cooler, and the pipettors were hung back up.

February 22

Lab 6: Gel Electrophoresis

Print Friendly, PDF & Email

2/21/19

Objective/Goals: The objective of this lab was to effectively set up the gel electrophoresis box with our samples. The goal was to determine if there is any DNA in our samples, and if so, how much.

Materials: Gel box, DNA sample, 1 x TAE buffer, micropipettor, ladder substance, tube

Procedure: 

Gel Electrophoresis

1. Make sure Gel is placed in buffer chamber and covered with the 1 x TAE buffer

2. For each sample, mix 9 μl of the DNA sample with 1 μl of the 10x loading buffer

3. Mix tube well and repeatedly tap on table

4. Load 10 μl of sample in lane 7

5. Load 5 μl of “31” 6.2 ng/μl in lane 6

6. Load 5 μl of “62.5” 12.5 ng/μl in lane 8

7. Run gel for 20-30 minutes at 100v

Gel Imagery

  1. Take gel out of electrode box
  2. Transfer gel to upstair lab
  3. Place gel block onto tray and insert into the gel imager
  4. Take pictures of the gel block with the visible DNA bands

Nanodrop

  1. Clean surface of the nanodrop machine with DI water
  2. Add one drop of DNA sample to machine
  3. Close lid
  4. Record data from screen

Data:

Nanodrop- 

884.6 ng/μl

1.44 A260/A280

0.41 A260/A230

Observations: A bright band of DNA showed up in my groups lane in the gel. However, the nanodrop analysis showed that our DNA sample was not very pure.

Storage: The gels were disposed and the boxes were emptied of water. All of the DNA sample tubes were placed back in the cooler.

Future Goals/Conclusions: Overall, I think it was successful that my group had some DNA, even though it was not as pure as we had hoped for; I did not expect the sample to be very pure because it was light brown in color. In the future, I would like to be able to secure a strong DNA sample and make sure it is very pure.


October 12

Excel Data/Class Statistics

Print Friendly, PDF & Email

10/11/18

Objectives/Goals: The objectives of this lab were to get an accurate excel sheet for the class data, compile our own relevant data into a new spreadsheet, and run the various stats for both the control and treatment groups in the cell counts and swim speed assay. The goals were to learn basic statistic skills in Excel, compile data, and interpret the results.

Materials: The materials did not involve lab equipment; however, the class used Excel spreadsheets to organize the data.

Procedure:

  1. Download class data excel sheet
  2. Use class data to organize the total cell count and swim speed data into a new excel sheet
  3. Label appropriate excel cells on new excel sheet
  4. Fill in data from class copy to new sheet (w/formatting, transposing, etc)
  5. Create descriptive statistics charts for each column
  6. Figure out the correct bins for all columns
  7. Create a histogram for each column
  8. Create an F-test chart for both cell counts and swim speeds
  9. Create T-test charts for both cell counts and swim speeds

Data:

Observations: Most of the data between the control and treatment groups look similar. The main differences were in the t-test for the cell counts. According to the current data, the treatment has had no significant impact on the tetrahymena.

Storage: The only storage that occurred in this lab was the storage of data on the computers.

Conclusion/Future Goals: Overall, the data/statistics calculations went well. I was able to easily follow the statistics guide to get the necessary calculations. I have concluded that the null hypothesis can be accepted for the swim speed, but I am unsure if it can be rejected for the cell counts (given that the p value for the cell counts is less that .05). In the future, I would like to be more confident in interpreting the data and coming up with accurate conclusions in results.

September 27

PP Microplastic Production/Ciliate Count Challenge/Assay

Print Friendly, PDF & Email

9/27/18

Objectives/Goals: This particular lab had many objectives; creating the microplastic solution, practicing a cell assay, and refining our cell-counting techniques. The overall goal was to become proficient at efficiently getting our cell counts and becoming familiar with performing different assays on the cells.

Materials: Petri dish lid, micropipettors, Tetrahymena stock solution, flat slide, dissecting microscope, compound microscope, iodine, ruler, baling twine, scissors, scale.

Procedure:

PP Microplastic Production-

  1. Cut the polypropylene (baling twine) into small pieces with scissors
  2. Measure 0.5 g of the PP in a sterile glass jar
  3. Boil (not done in class)
  4. Filter with 5 μl paper (not done in class)
  5. Autoclave and store (not done in class)

Ciliate Count Challenge-

  1. Add 20 μl of TH to 5 μl of Iodine on a petri lid
  2. Mix
  3. Add 3 separate drops (5 μl) to a slide without coverslip
  4.  Count cells using 4x or 10x objective
  5. Record all 3 trials

Simple Swim Speed Assay-

  1. Place 20 μl drop of culture on flat slide
  2. Set slide on top of ruler between 2 mm lines (1 mm gap)
  3. Pick a cell to watch
  4. Time how quickly the cell can swim 1 mm
  5. Record for 10 different cells
  6. Calculate average and standard deviation

Data:


Observations: The cells in the 3 trials were simple to count. I easily observed the swimming speeds of the tetrahymena with the video I took (I used Dr. Adair’s phone lens apparatus).

Storage: The slides were rinsed with the cleaning solution and water and were placed on paper towels to dry. The microscopes had their cables wrapped and were covered. The used micropipettor tips were discarded, and the micropipettors were hung on their racks. The stock solution, Tetrahymena media, and well plates were left on the tables for the instructors to handle.

Conclusion/Goals: This lab went efficiently, and with no mishaps. I was able to perform all 3 trials for the cell count and all 10 trials for the swimming speed. The video I took of the tetrahymena swimming was very helpful because I was able to slow the video down and note the exact times. Overall, I am pleased with how this lab went. I am able to tell that with each lab, I am becoming more skilled at the lab techniques. My next goal is to become more precise when counting the tetrahymena.