November 15

Lab 13: Ciliate Isolation and Characterization

Print Friendly, PDF & Email

Rationale: The purpose of this experiment was to be able to perform a soil sedimentation test and to find ciliates in either our own soil sample, or the samples provided.

Procedure:

  1. Soil Sedimentation Test
    1. Retrieve the tube from the previous lab that contains the soil and water.
    2. Using a ruler, measure the amount of sand, silt, and clay using centimeters as the units of measure.
    3. Add the amounts together to determine the total.
    4. To find the percent composition of each component, take the individual components amount, divided by the total, and multiply the result by 100.
  2. Ciliate Isolation
    1. Observe the original soil sample under a dissecting microscope.
    2. If no ciliates are found, use a micropippetor to extract solution from the sample provided by the professor.
    3. Place the drop on a concavity slide and observe the slide under a compound microscope.
    4. Photograph or record any ciliates found.

Data:

Soil Sample

Soil Sedimentation Test Results Amount Percent Composition
Clay 0.1 cm (.1/1.7) x 100 = 5.88%
Silt 0.6 cm (.6/1.7) x 100 = 35.3%
Sand 1 cm (1/1.7) x 100 = 58.8%
Total 1.7 cm

Storage: After completing the lab, I washed and bleached the concavity slide I used, as well as powered off and unplugged the microscopes I used. I covered them and returned my soil samples in the petri dish and tube back to their places.

Conclusion: From this experiment, I was able to find ciliates in the samples provided in the lab. I was not able to classify two of them, however I believe the third one I saw may be Didinium. I was also able to conclude that my soil sample is sandy loam, based on the results received from the sedimentation test. In the future, I hope to find more ciliates in samples and be able to classify ciliates with complete certainty.

October 26

Lab 10: Results and Analysis; Slide Presentation

Print Friendly, PDF & Email

Components of a Scientific Paper:

  1. Title Page
    1. The first page should include the title of the article, group members’ names, class name and section, and semester. The title should provide relevant information, but remain brief.
  2. Abstract
    1. The abstract is written after the paper is completed. It is a short summary of the article (one paragraph) and briefly touches on each component of the article.
  3. Introduction
    1. The introduction includes background information found from research to inform the readers with context and why the experiment is significant. The information provided should allow for the reader to comprehend the article and understand why the experiment was performed. The introduction should be in a funnel format, starting with general information and getting more specific as it continues on.
  4. Materials and Methods
    1. The methods section includes all the procedures in detail and explanations as to why they were performed. The procedures should be detailed enough for the experiment to be replicated exactly. This should also include chemical information about the media and toxin, as well as be written in the past tense.
  5. Results and Discussion
    1. The results section should include every outcome from the procedure, as well as an analysis. The data and figures should also be analyzed as well. This section summarizes the results and interprets the data acquired. Figures should be numbered in the order that they appear in the text, and should be easy for the reader to interpret. Statistical analysis should also be included and explained in all figures.
    2. The discussion section draws conclusions from the results and relates the results back to the overall problem that the experiment addresses. The discussion also includes comparisons to other research and experiments to draw conclusions based on similarities and differences between the results.
  6. Acknowledgements and Citations
    1. Citations are used in the lab report to prevent plagiarism and to give credit where credit is due.
October 12

Lab 8: Data Analysis

Print Friendly, PDF & Email

Rationale: The objective of this lab was to gain experience using Excel to perform statistical analysis and to do calculations for large quantities of data, as well as use Word to create a document describing our procedure.

Procedure:

  1. Create a new Excel spreadsheet and copy class data from control and treated cell counts and control and treated direction changes.
  2. Make two separate columns for direction changes and spin counts for both control and treated data.
  3. Place data into separate columns based on category.
  4. Find the Descriptive Statistics for each category and place on the spreadsheet.
  5. Create a Histogram for each category and place underneath the corresponding Descriptive Statistics.
  6. Use Data Analysis to complete the F-test for Variances
    1. Test control vs treated cell counts, control direction changes vs treated direction changes, and control vs treated spin counts
    2. Place data charts under the corresponding category
  7. Use Data Analysis to complete the T-test for Unequal Variances
    1. Test control vs treated cell counts, control direction changes vs treated direction changes, and control vs treated spin counts
    2. Place data charts under the corresponding category


Data:

  1. Descriptive Statistics
  2. Histograms
    1. Treatment Spin Counts

      Treatment Direction Changes

      Control Spin Counts

      Control Direction Change

      Treatment Cell Counts


  3. F-test for Variances
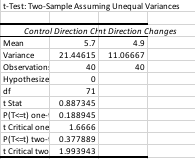
  4. T-test for Unequal Variances


Conclusion: From this experiment, I was able to use Excel to calculate descriptive statistics, F-tests, T-tests, and create histograms. The descriptive statistics were able to show the results regarding the mean and standard variance, providing me with useful data to use in future experiments. The F- and T-tests also calculated the mean and variances for the sets of data from the control and treated solutions. The histograms displayed the frequency of the collected data in a bar graph with frequency on the y-axis and bin on the x-axis. I found these tools in Excel to be very helpful in providing a visual for the data collection. In the future, I hope to use Excel to help with calculations and finding the statistical data I need.

October 5

Lab 7: Materials and Methods: Performing the Experiment (Direction Change Assay)

Print Friendly, PDF & Email

Rationale: The purpose of this experiment was to be able to observe and count the Tetrahymena from a controlled environment, as well as an environment that had been diluted. Another goal of the experiment was to record the amount of times the Tetrahymena changed their direction of motion in both environments. We also wrote out a first draft of the Methods portion of our group experiment.

Procedure:

  1. Obtain samples of both the controlled and treated culture.
  2. Using a micropipettor, place a drop of 5μl of the culture onto a flat microscope slide.
  3. Using a new micropipettor tip, drop 2μl of iodine into the drop of culture on the slide.
  4. Place the slide under the dissecting microscope and count how many Tetrahymena are in the drop.
  5. Obtain a new, clean slide and place a drop of 20μl of culture on it
  6. Observe the slide for ten seconds and follow the direction changes of one cell.
  7. Repeat step 6 for 9 other cells.

Data:

Cell # of direction changes in 10 seconds (controlled) # of direction changes in 10 seconds (treated)
1 16 8
2 15 9
3 12  6
4 10  2
5  11  7
6 13  4
7 14  9
8 10  2
9 12  9
10 16  4
Average 12.9  6
Standard Deviation 1.29  2.828

Images and counts of controlled and treated culture:

Controlled: 42,833 (average)

Treated: 259,500 (average)


Density
PPT 0
PPT + “twine juice” .068
PPT + TH .004
PPT + TH + “TJ” .143

Storage: After completing the experiment, I washed the slides with bleach and water and left them on the paper towels to dry. I turned off and covered the dissecting microscope. All micropipettor tips were properly disposed of and the micropipettors were returned to where they were found.

Conclusion: From this data, I learned that the treated culture had less direction change than the controlled culture. The treated culture mostly twitched in place while a few of the cells moved around. There was a lot more direction change in the controlled culture, however, there were also fewer cells in sight. I plan to use the data collection from this experiment as practice for my group experiment in the future. I also plan to improve upon my Methods draft and do more research on my experiment.

September 21

Lab 5: Serial Dilution and Cell Count

Print Friendly, PDF & Email

Rationale: The purpose of this experiment is to be able to determine the concentration of a culture, in this case Tetrahymena. In order to count the population of a culture, we must perform a dilution. After performing the experiment, we will also go to the computer lab to begin setting up our group experiment and perform research.


Procedure:

  1. Add 900μl of Tetrahymena into wells A1, B1, C1, and D1.
  2. Label A1 as 10^-1, B1 as 10^-2, C1 as 10^-3, and D1 as 10^-4.
  3. Take 100μl of the undiluted stock culture and add it to 10^-1 and mix by pipetting repeatedly. Change tips.
  4. Take 100μl of the 10^-1 sample and add it to 10^-2 and mix by pipetting repeatedly. Change tips.
  5. Take 100μl of the 10^-2 sample and add it to 10^-3 and mix by pipetting repeatedly. Change tips.
  6. Take 100μl of the 10^-3 sample and add it to 10^-4 and mix by pipetting repeatedly. Change tips.
  7. Transfer 5μl of the most ideal sample to a concavity slide and observe under a dissecting microscope.
  8. Record data.


Data:

Trial Dilution Cell count in 5μl Cells per μl in the drop Cells/μl in the undiluted sample Cells/ml in the undiluted sample
1 10^-2 1 0.2 100 100,000
2 10^-2 0 0 0 0
3 10^-2 3 0.6 300  300,000
Avg. 1.33 2.66 133 133,333


Storage: After completing the lab, I washed and bleached my concavity slides. I properly disposed of the micropipettor tips after each use and turned off the microscope and covered it.


Conclusion: From this data, I was able to successfully count the amount of cells in a given sample after dilution. I also learned how to dilute multiple samples with the stock culture. In the computer lab, I was able to work successfully with my partners and design an experiment to study Tetrahymena and the effects of polypropylene.


September 14

Tetrahymena Lab 9/13/18

Print Friendly, PDF & Email

Rationale: The purpose of this lab is to experience working with different micropipettors and be able to search for valid research articles via PubMed.

Procedure:

  1. Observe Tetrahymena in the 24-well plate through a dissecting microscope.
  2. Use a P-10 pipettor to take 5μl of the sample.
  3. Place the 5μl onto a concavity slide and observe through a compound microscope.
    1. Observe at different magnifications
    2. Use a coverslip when viewing at 40x.
  4. Count how many cells per 5μl.
  5. Record data and estimate cell diameter.

Data:

Trial # number of cells in 5μl diameter of cell images
1  30  66μm
2 25 55μm

at 40xdrawing of Tetrahymena


Storage: The concave slides were washed and bleached after use and put on a paper towel to dry. The microscopes were also turned off, unplugged, and covered. The micropipettor tips were properly disposed of in the little waste bucket.

Conclusion: From this experiment I was able to use different micropipettors and observe Tetrahymena through a dissecting microscope. Also, in the computer lab, I was able to search for relevant research articles about microplastics and their effect on the terrestrial environment. In the future, I hope to measure the diameters of other cells and use micropipettors to get more accurate sample amounts.

September 7

9/6/18

Print Friendly, PDF & Email

Objective: The objective of this lab was to observe the effects of iodine stains, methyl cellulose, and MGP on ciliates.

Purpose: The purpose of this lab was to be able to learn the parts and how to operate a compound microscope, set up and observe organisms on concave and plain slides, and use different stains.

Procedure:

  1. Observe ciliate samples and record which are living and dead.
  2. Take a drop of one living sample and put it on a coverslip.
  3. Place the cover slip onto a concave slide.
  4. Observe the slide through the compound microscope and record data.
  5. Take a drop of the same sample and place it on a new, plain slide.
  6. Add a drop of iodine stain to the sample and place coverslip on top.
  7. Observe slide and record data.
  8. Repeat step 5, add a drop of MGP and place coverslip on top.
  9. Record Data.
  10. Repeat step 5, add a drop of methyl cellulose and place coverslip on top.
  11. Record Data.

Data Table:

A4 Hanging Concavity Iodine Stain MGP Stain Methyl Cellulose
movement slow, sluggish none none slow moving
shape deformed oval deformed oval deformed oval deformed oval
size 3x across diameter at 40x 3x across diameter at 40x 2x across diameter at 40x 3x across diameter at 40x
sketch
other characteristics slow, faded maroon color brownish color turned a purple color because of stain faded maroon color


Conclusion: After learning how to use a compound microscope, we were able to successfully observe live ciliates closely. We were able to record movement, shape, color, and size.We also observed that the methyl cellulose, iodine stain, and MGP stain affected the ciliate’s movement and color. The MGP stain also increased the size of the ciliate. From this experience, I plan to see how different stains affect other kinds of ciliates that I was not able to test during this experiment.

August 31

Lab 2: The Ciliate Challenge

Print Friendly, PDF & Email

Objective: The objective is to gain experience using dissecting microscopes.

Purpose: The purpose of this experiment is to be able to correctly identify unknown ciliates.

Procedure:

  1. Uncover microscope and plug it into the nearest outlet.
  2. Adjust settings to fit needs.
  3. Take pipette 1 and suck up sample from tube 1.
  4. Place sample from pipette 1 into A1 well (no more than half way).
  5. Repeat previous steps for all 6 samples, place in different wells
  6. Place well under microscope.
  7. Adjust zoom and focus to see ciliates.
  8. Record data.

Data Table:


Unknown # Shape Relative Size Movement Location Other Characteristics Sketch/Identity
1 oval shape very tiny medium speed, not hyperactive nor sluggish around the edges of the well somewhat transparent Euplotes
2 circular similar size to sample 1 free floating, occasional spins edge of the wells dark rear, transparent Aspidisa
3 oval large compared to samples 1 and 2 straight lines with occasional sharp turns some in the middle of the well, crowds around edges high abundance Paramecium
4 flat, sliver similar size to sample 3 free floating, pretty still edges calm moving Paramecium
5 thin oval largest size expand and contract center of the wells dark color Spirostomum
6 oval smallest slow edges greenish color Stentor

Conclusion: From this experiment, we learned how to operate a dissecting microscope. We were able to gather enough information from what we observed through the microscope in order to identify the ciliates and describe characteristics of their behavior and structure. From this experience, I plan to be more efficient with a microscope and be able to closely observe more organisms.