Chandler Opara
April 18,2019
Soil eDNA Metabarcoding Analysis: QIIME 2
Objectives/Purpose:
The objective of the lab was to analyze the Chelex eDNA sample and PowerSoil eDNA sample using QIIME2. The purpose of doing this was to examine the presence of the diverse ciliate species.
Procedures:
Re-Installing QIIME2:
- Go to the Miniconda website and download 64-bit (.pkg installer) version of Miniconda Python 3 for Mac OS X computers.
- Using the launch pad, open up the Terminal and type conda update conda. Type y to start the downloading process. Make sure all the files have been downloaded.
- Copy and paste the link from the webpage called “Natively installing QIIME 2” into the command of the Terminal to start the cleanup process.
- Activate the QIIME 2 environment by typing “source activate qiime2-2019.1” into the command
- In order to test the installation, type qiime –help in the terminal. Check if there are any errors when running the command.
Soil Edna Analysis with QIIME2
- Go to the link BOX Folder and download the folder with the files. The following files are Emp folder, Qiime walkthrough, sample metadata, and silva
- We will use the Qiime walkthrough document to complete the analysis.
- Open a neew terminal and activate Qiime2 by typing:
- source activate Qiime2-2019.1
- Next, create a folder named CILICURE_2018. In the terminal, change the directory by typing in:
- Import sequences as QIIME2 artifact:
- qiime tools import \–type EMPPairedEndSequences \
–input-path emp-paired-end-sequences \
–output-path emp-paired-end-sequences.qza
- The next step would be to demultiplex the sequences. This means that the sequences will be grouped according to the samples they belong along. In order to do this, type the following:
- qiime demux emp-paired \–m-barcodes-file sample-metadata.tsv \
–m-barcodes-column BarcodeSequence \
–i-seqs emp-paired-end-sequences.qza \
–o-per-sample-sequences demux.qza \
- q qiime demux summarize \
–i-data demux.qza \
–o-visualization demux.qzv
- The .qza file was converted into a .qzv file for viewing.To view this qzv file, open the webpage “QIIME2 View” on your browser. Drag the qzv file into the chosen area in the webpage. This showed a summary of our demultiplexed results.
- After demultiplexing the sequences, we need to denoise the sequences. This mean we are just cleaning up any messy sequence data. We denoised the sequences using DADA2 to 220 bases. In order to do this, input the command:
- qiime dada2 denoise-paired \
–i-demultiplexed-seqs demux.qza \
–p-trunc-len-f 220 \
–p-trunc-len-r 220 \
–o-table table.qza \
–o-representative-sequences rep-seqs.qza \
–o-denoising-stats denoising-stats.qza
- A feature table was created to summarize all of the results. To create a feature table, input the command:
- qiime feature-table summarize \
–i-table table.qza \
–o-visualization table.qzv \
–m-sample-metadata-file sample-metadata.tsv
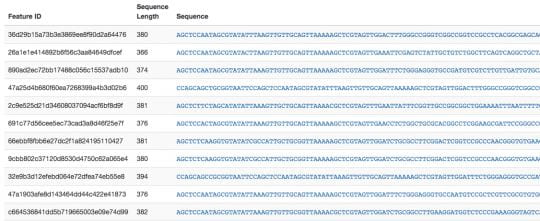
- qiime feature-table tabulate-seqs \
–i-data rep-seqs.qza \
–o-visualization rep-seqs.qzv
- q qiime metadata tabulate \
–m-input-file denoising-stats.qza \
–o-visualization denoising-stats.qzv
- The .qza file was converted into a .qzv file for viewing.To view this qzv file, open the webpage “QIIME2 View” on your browser. Drag the qzv file into the chosen area in the webpage. This will show the feature table.
- After creating a feature table, we created a phylogenic tree by inputting the command:
- qiime phylogeny align-to-tree-mafft-fasttree \
–i-sequences rep-seqs.qza \
–o-alignment aligned-rep-seqs.qza \
–o-masked-alignment masked-aligned-rep-seqs.qza \
–o-tree unrooted-tree.qza \
–o-rooted-tree rooted-tree.qza
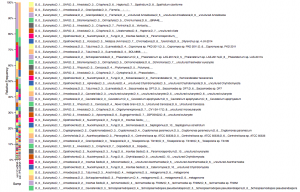
- Finally, we created a chart with taxonomic classification to explore the taxonomic composition of the samples, input this command:
- qiime feature-classifier classify-sklearn
–i-classifier silva-132-99-515-806-nb-classifier.qza
–i-reads rep-seqs.qza
–o-classification taxonomy.qza
- qiime metadata tabulate \
–m-input-file taxonomy.qza \
–o-visualization taxonomy.qzv
–i-table table.qza \
–i-taxonomy taxonomy.qza \
–m-metadata-file sample-metadata.tsv \
–o-visualization taxa-bar-plots.qzv
- In order to view this qzv file and taxa-bar-plots.qzv file, repeat step 10.
Data:
Demultiplexed Results:

Denoise Results

Taxonomy Bar Plot Results

Conclusion/ Future Goals:
In conclusion, this lab allowed us to create a visual representation of the biodiversity found in our sample. The taxa bar plot showed that the PowerSoil sample contained around 25% of organisms from the supergroup SAR when compared to the Chelex sample which contained 54% of those organisms. The visualization and analysis of the data helped provide information about the community composition and added information to a scientific database, which connects similar research to other resources. With the use of PubMeD, we were able to see the various identifications of the ciliates. In the future, I am curious to see how the CyVerse platform and Jupyter Notebooks will provide more information about our sequences. Overall, this lab was successful since I have become more comfortable with the QIIME2 program and using the terminal.