Week 13

Objective
- Continue using and getting comfortable with Qiime2
- Analyze our eDNA from the soil samples, both the Chelex and PowerSoil samples, through Qiime tools
Procedure
- Retrieve the folder containing all the data from the Box link
- Open Terminal and make sure Qiime2 is installed and running correctly
- Activate Qiime2
- source activate qiime2-2019.1
- Change the directory to the downloaded folder in the Terminal
- cd (copy and paste the folder into the Terminal)
- Import sequences as Qiime2 artifact
- qiime tools import \
–type EMPPairedEndSequences \
–input-path emp-paired-end-sequences \
–output-path emp-paired-end-sequences.qza
- qiime tools import \
- Demultiplex the sequence
- qiime demux emp-paired \
–m-barcodes-file sample-metadata.tsv \
–m-barcodes-column BarcodeSequence \
–i-seqs emp-paired-end-sequences.qza \
–o-per-sample-sequences demux.qza \
- qiime demux emp-paired \
- Create a summary for the demultiplexed sequences
- qiime demux summarize \
–i-data demux.qza \
–o-visualization demux.qzv
- qiime demux summarize \
- Denoise up to 220 bases
- qiime dada2 denoise-paired \
–i-demultiplexed-seqs demux.qza \
–p-trunc-len-f 220 \
–p-trunc-len-r 220 \
–o-table table.qza \
–o-representative-sequences rep-seqs.qza \
–o-denoising-stats denoising-stats.qza
- qiime dada2 denoise-paired \
- Create a feature table to summarize and list all the sequences
- qiime feature-table summarize \
–i-table table.qza \
–o-visualization table.qzv \
–m-sample-metadata-file sample-metadata.tsv
- qiime feature-table summarize \
- Tabulate the feature table
- qiime feature-table tabulate-seqs \
–i-data rep-seqs.qza \
–o-visualization rep-seqs.qzv
- qiime feature-table tabulate-seqs \
- Visualize the stats of the denoising outcome
- qiime metadata tabulate \
–m-input-file denoising-stats.qza \
–o-visualization denoising-stats.qzv
- qiime metadata tabulate \
- Create a phylogenetic tree
- qiime phylogeny align-to-tree-mafft-fasttree \
–i-sequences rep-seqs.qza \
–o-alignment aligned-rep-seqs.qza \
–o-masked-alignment masked-aligned-rep-seqs.qza \
–o-tree unrooted-tree.qza \
–o-rooted-tree rooted-tree.qza
- qiime phylogeny align-to-tree-mafft-fasttree \
- Run the data against a reference database
- qiime feature-classifier classify-sklearn –i-classifier silva-132-99-515-806-nb-classifier.qza –i-reads rep-seqs.qza –o-classification taxonomy.qza
- Tabulate a table with all the sequences and classification information
- qiime metadata tabulate \
–m-input-file taxonomy.qza \
–o-visualization taxonomy.qzv
- qiime metadata tabulate \
- Tabulate a barplot with all the classification information
- qiime taxa barplot \
–i-table table.qza \
–i-taxonomy taxonomy.qza \
–m-metadata-file sample-metadata.tsv \
–o-visualization taxa-bar-plots.qzv
- qiime taxa barplot \
Results
Demultiplexed:

Denoised:

Taxonomy Table:

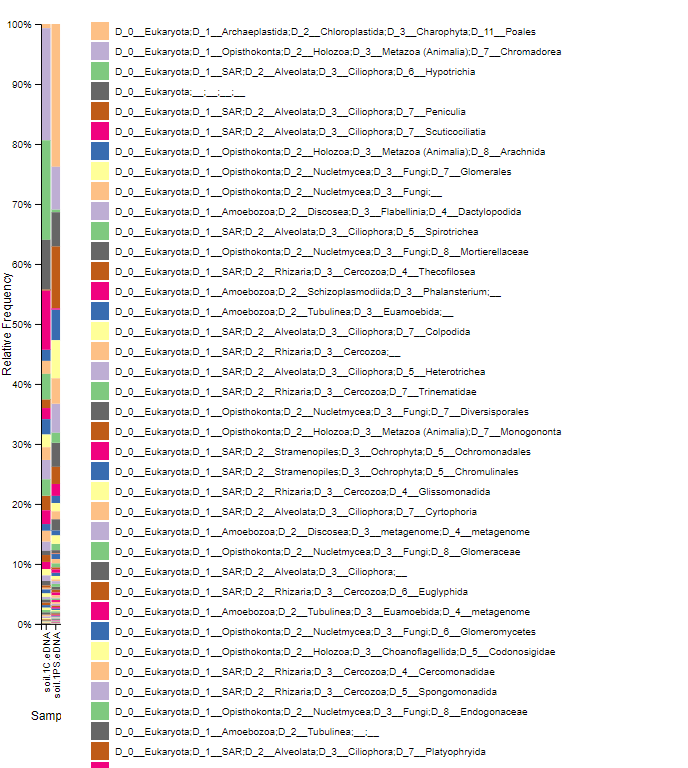
Taxonomy Barplot:
Conclusion
I feel much more confident in working with Qiime2 and the Terminal. Running the commands is much more easier and I am beginning to understand what the different commands do and how the data is being processed.