Lab 13

Aynsley Gaspard
4-18-19
BIO 1106
Lab 13
Purpose:
The purpose of this lab was to learn how to perform metabarcoding analysis well. We did this by using sample data from an eDNA sample from soil of Bermuda grass from the Blackland Prairie Soil. We ran the data through Qiime2 to get the taxonomic qzv. files to visualize and analyze it.
Procedure:
- Open terminal
- Activate qiime2 [source activate qiime2-2019.]
- Download box files
- Make the directory for the files [cd /Users/aynsleygaspard/Documents/CILICURE_2018]
- Import the sequences as a qiime2 artifact [qiime tools import \–type EMPPairedEndSequences \–input-path emp-paired-end-sequences \–output-path emp-paired-end-sequences.qza]
- Demultiplex the sequences to align the data [qiime demux emp-paired \–m-barcodes-file sample-metadata.tsv \–m-barcodes-column BarcodeSequence \–i-seqs emp-paired-end-sequences.qza \–o-per-sample-sequences demux.qza \qiime demux summarize \–i-data demux.qza \–o-visualization demux.qzv]
- Denoise the data with DADA2 to get rid of low quality sequences and create a feature table with representative sequences [qiime dada2 denoise-paired \–i-demultiplexed-seqs demux.qza \–p-trunc-len-f 220 \–p-trunc-len-r 220 \–o-table table.qza \–o-representative-sequences rep-seqs.qza \–o-denoising-stats denoising-stats.qzaqiime feature-table summarize \–i-table table.qza \–o-visualization table.qzv \–m-sample-metadata-file sample-metadata.tsvqiime feature-table tabulate-seqs \–i-data rep-seqs.qza \–o-visualization rep-seqs.qzvqiime metadata tabulate \–m-input-file denoising-stats.qza \–o-visualization denoising-stats.qzv]
- Create a phylogenetic tree [qiime phylogeny align-to-tree-mafft-fasttree \–i-sequences rep-seqs.qza \–o-alignment aligned-rep-seqs.qza \–o-masked-alignment masked-aligned-rep-seqs.qza \–o-tree unrooted-tree.qza \–o-rooted-tree rooted-tree.qza]
- Get the taxonomic classification [qiime feature-classifier classify-sklearn –i-classifier silva-132-99-515-806-nb-classifier.qza –i-reads rep-seqs.qza –o-classification taxonomy.qzaqiime metadata tabulate \–m-input-file taxonomy.qza \–o-visualization taxonomy.qzvqiime taxa barplot \–i-table table.qza \–i-taxonomy taxonomy.qza \–m-metadata-file sample-metadata.tsv \–o-visualization taxa-bar-plots.qzv]
- Drag the taxanomic qzv. file into the qiime2 viewer and analyze the eDNA
Data:
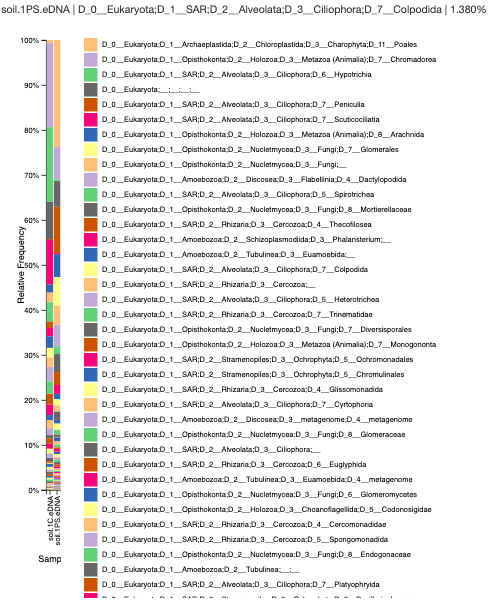
Analysis and Conclusion: The Chelex/Silica bead sample has a high amount of chromodorea DNA, which is a type of roundworm. The Powersoil sample consists of the flowering plants called Poales. The Chelex seems to have a high amount of nematodes and ciliates, but the Powersoil sample has a lot of plant material and amoebas. I was able to look at the hight amount of diversity in the sample as well.
Future Goals: In the future, I would like to be able to use these processes with future research and in my future career, if needed.