October
19
Lab #9 Making Figures 10/19/18

Objective/Purpose: The purpose of this lab is to make figures over the data that your table group of 3 found. We looked at the mean values of the control and treatment levels of cell counts as well as vacuole count, swim speed, and direction changes.
Materials:
Laptop
Data from experiment
Procedure:
- Log onto computers and opened up excel
- Share a single excel folder so group can add their own data
- Input the mean of the control for cell counts and optical density
- Input the mean of the treatment for cell counts and optical density
- Select data from both treatment and control for cell counts
- Make bar graph from recommended charts tab
- Click on chart designs and then add chart elements so you can add error bars
- Make sure title and axes are correctly labelled
- Do steps 5-8 for optical density, and vacuole formation
- Save all graphs as JPEGs
Figure 1

Figure 2
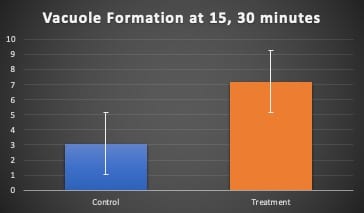
Figure 3

Figure 4

Storage: we made sure the area was all cleaned up and that all the computers were logged off.
Conclusion/Future Goals: We created our graphs and these will be included in our rough draft that is due next week. The graphs help show a visual representation of the data that was found. Through these graphs, it helps the reader understand the implications that polypropylene have on tetrahymena cultures.