November 27

Lab experiment #13 (11/16/17)

Print Friendly, PDF & Email

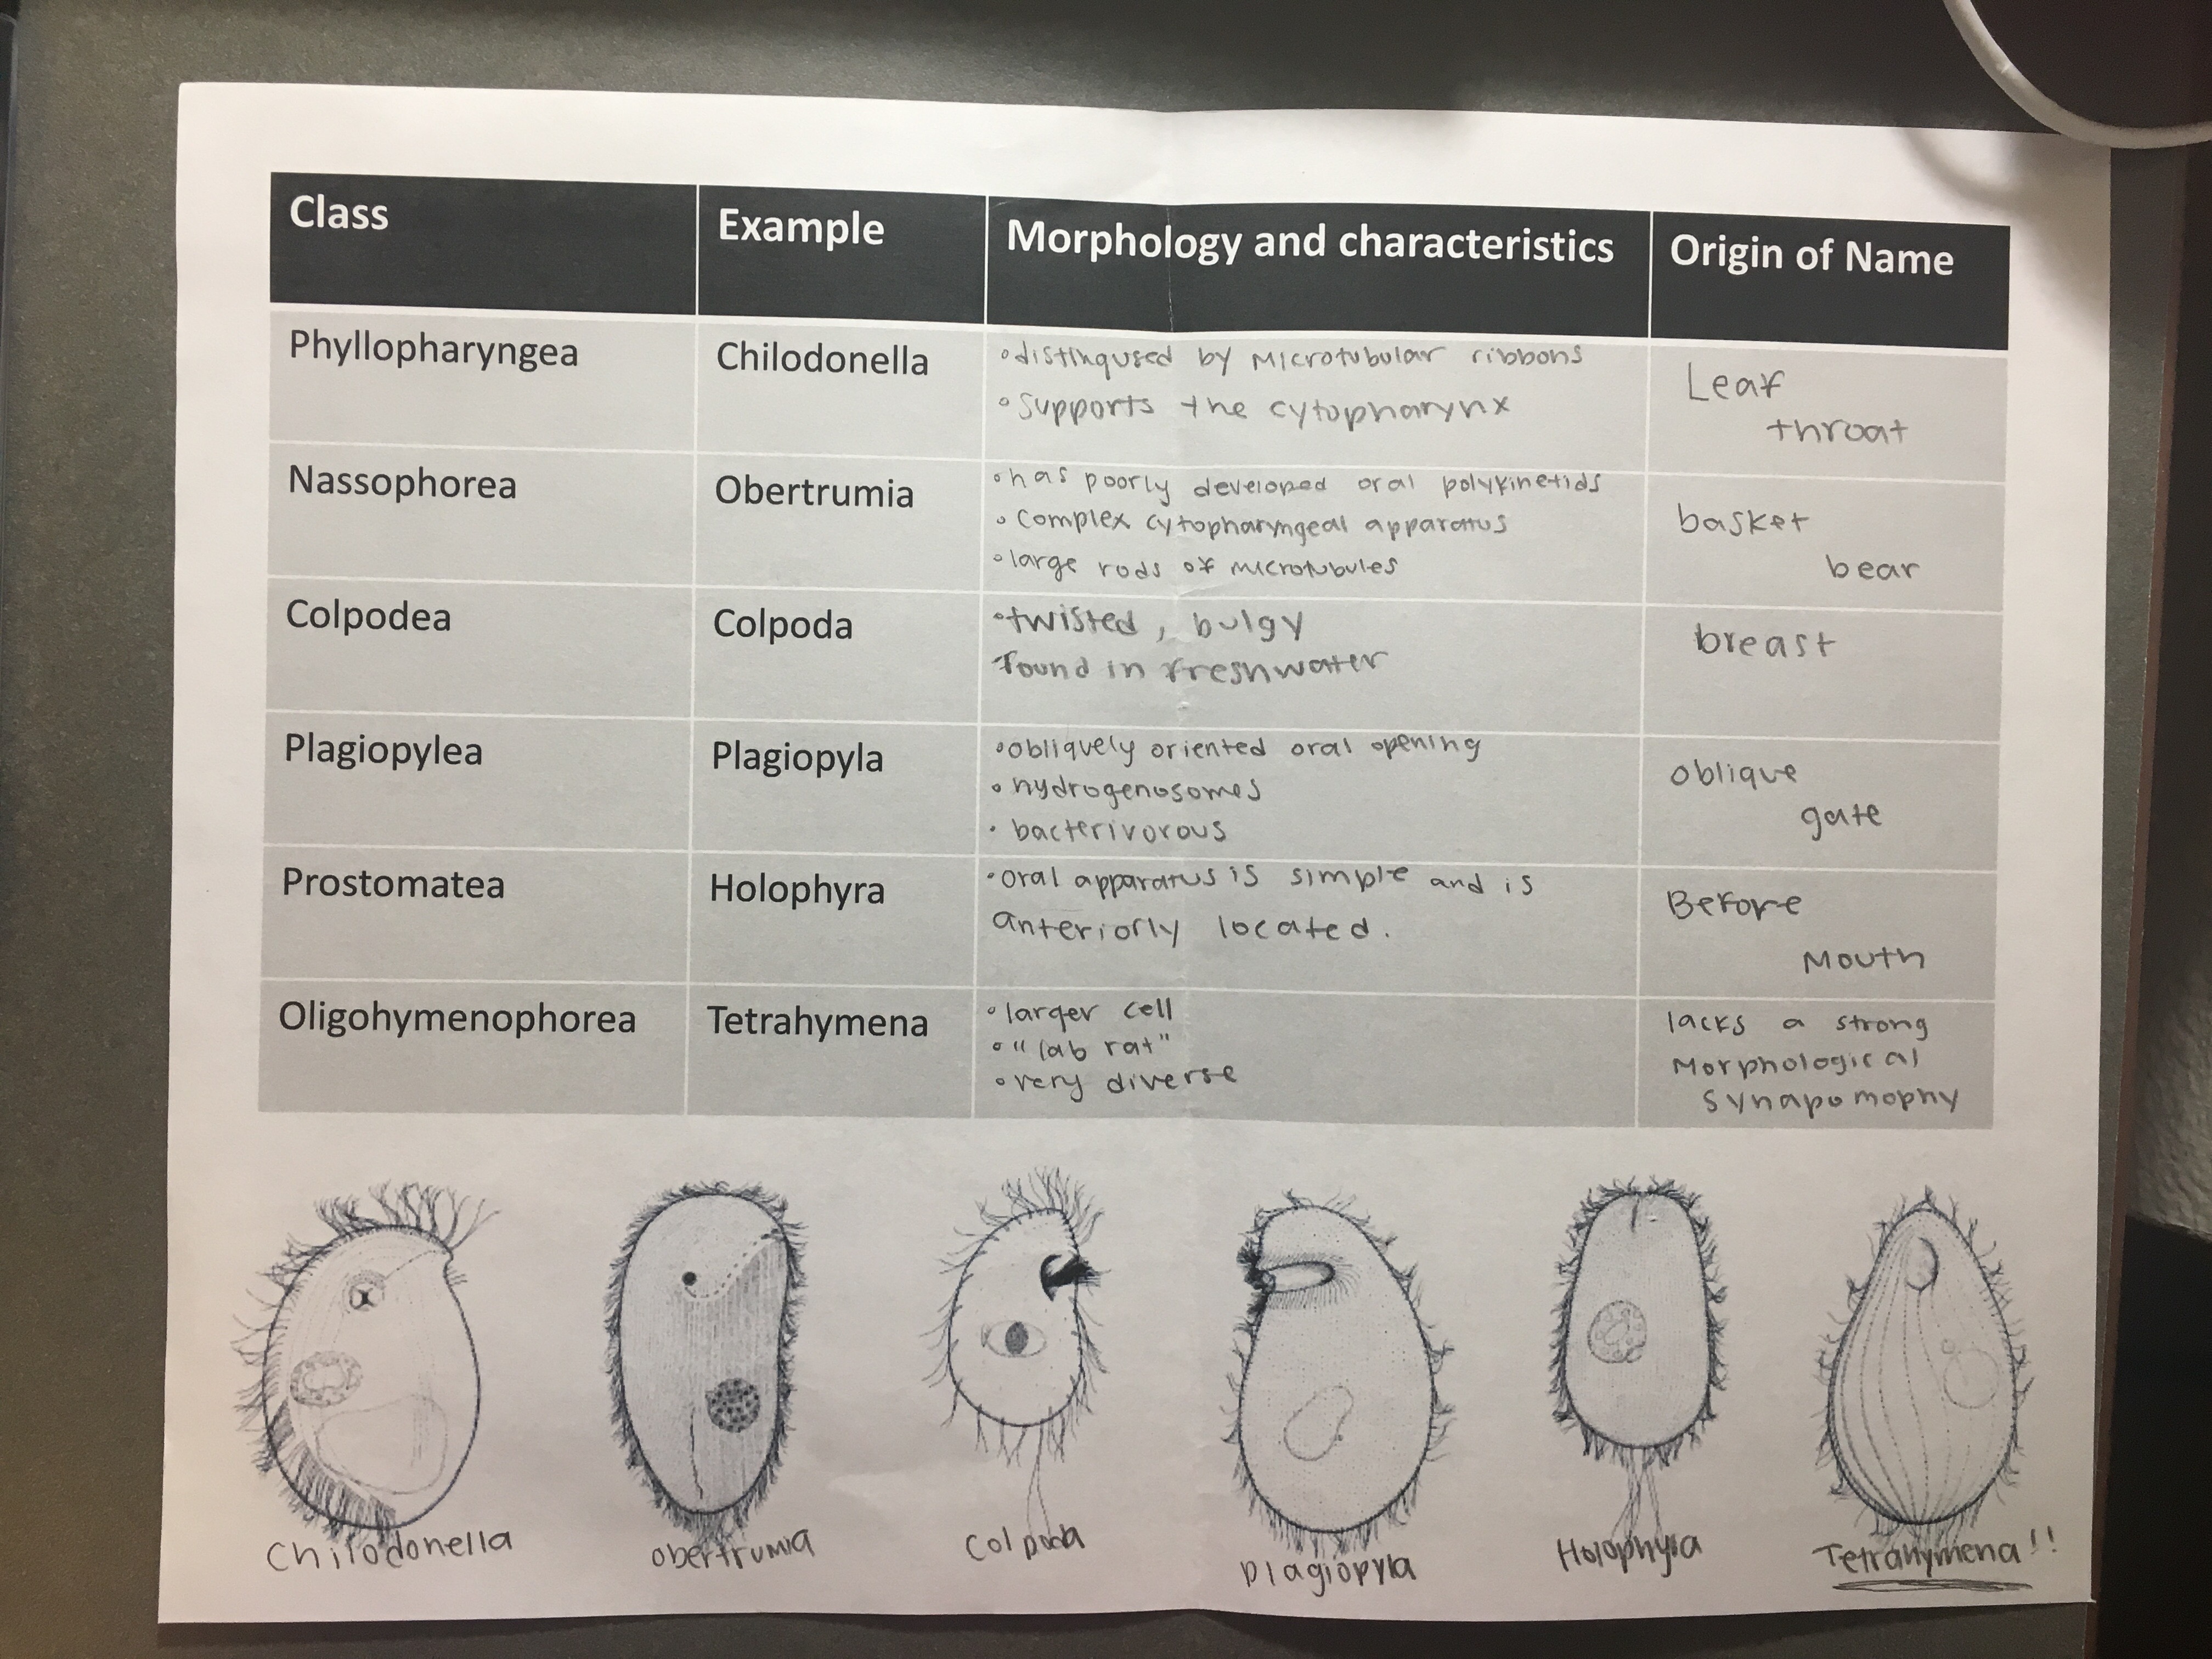
Purpose: The purpose of this experiment was to discover and try to identify the ciliates found in the previous lab.

Procedure:

  1. Bring the well plate with your ciliate culture to your desk.
    1. If you did not create a well plate because you couldn’t find ciliates in your soil sample, create a well plate using Dr. Adair’s ciliate sample.
  2. Examine the well plate under a dissecting microscope to find more ciliates.
  3. After finding ciliates in your well plate, pipette 10 microliters of the sample on to a slide.
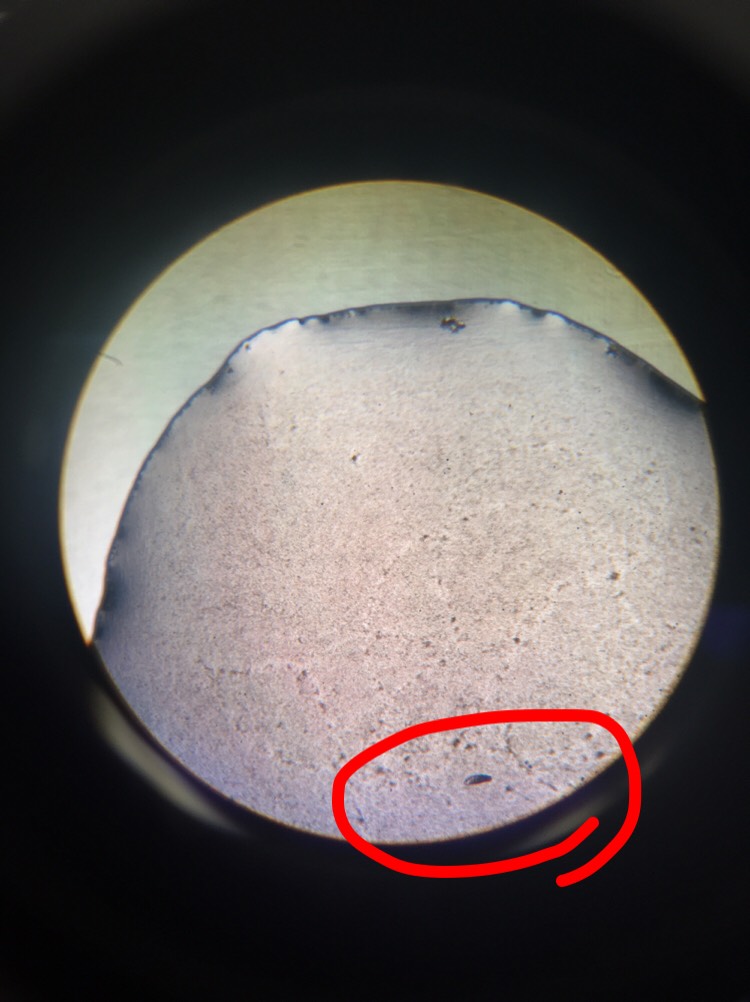
  4. Use a compound microscope to find ciliates on your slide.
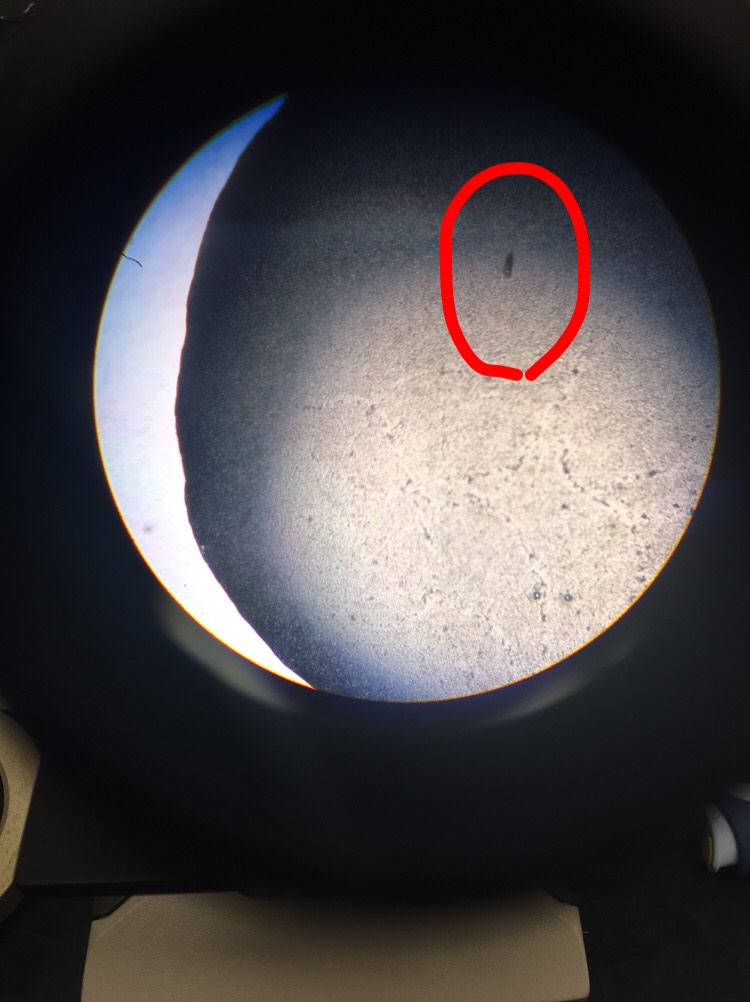
  5. Take photos of your ciliates.
    1. If you can’t take photos of the ciliates because they are too fast, pipette about 3 microliters of methylcellulose on your sample.
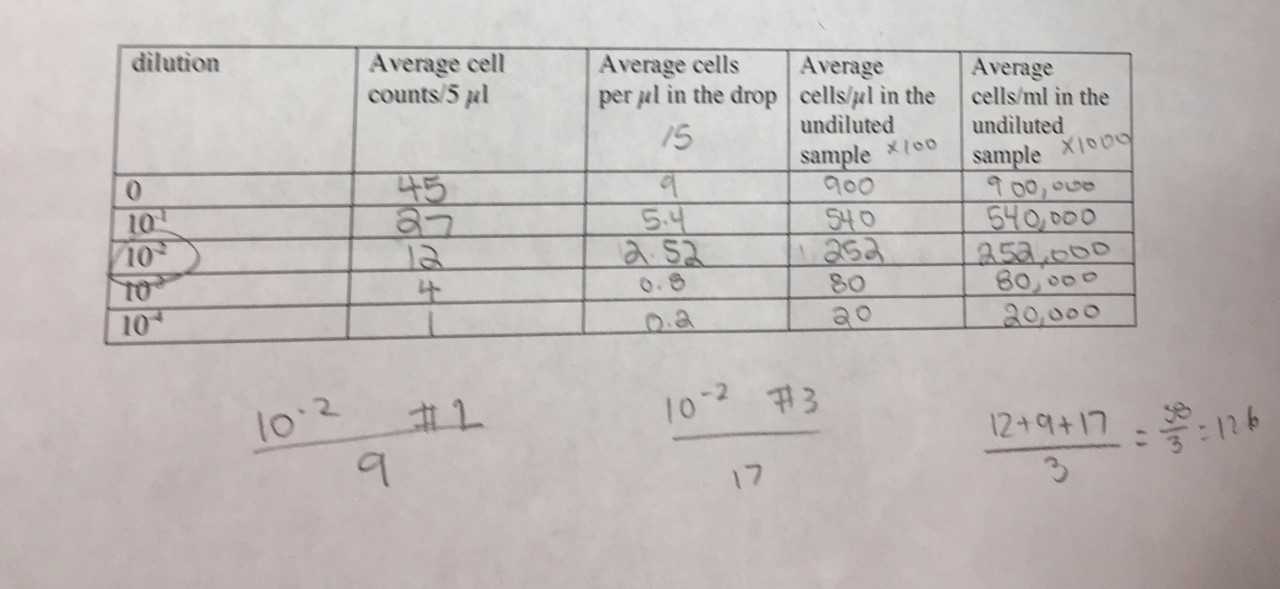
Results:

I found three ciliates in my soil sample, but I could not capture and culture them. I ended up using Dr. Adair’s sample, and I was able to find more ciliates. 

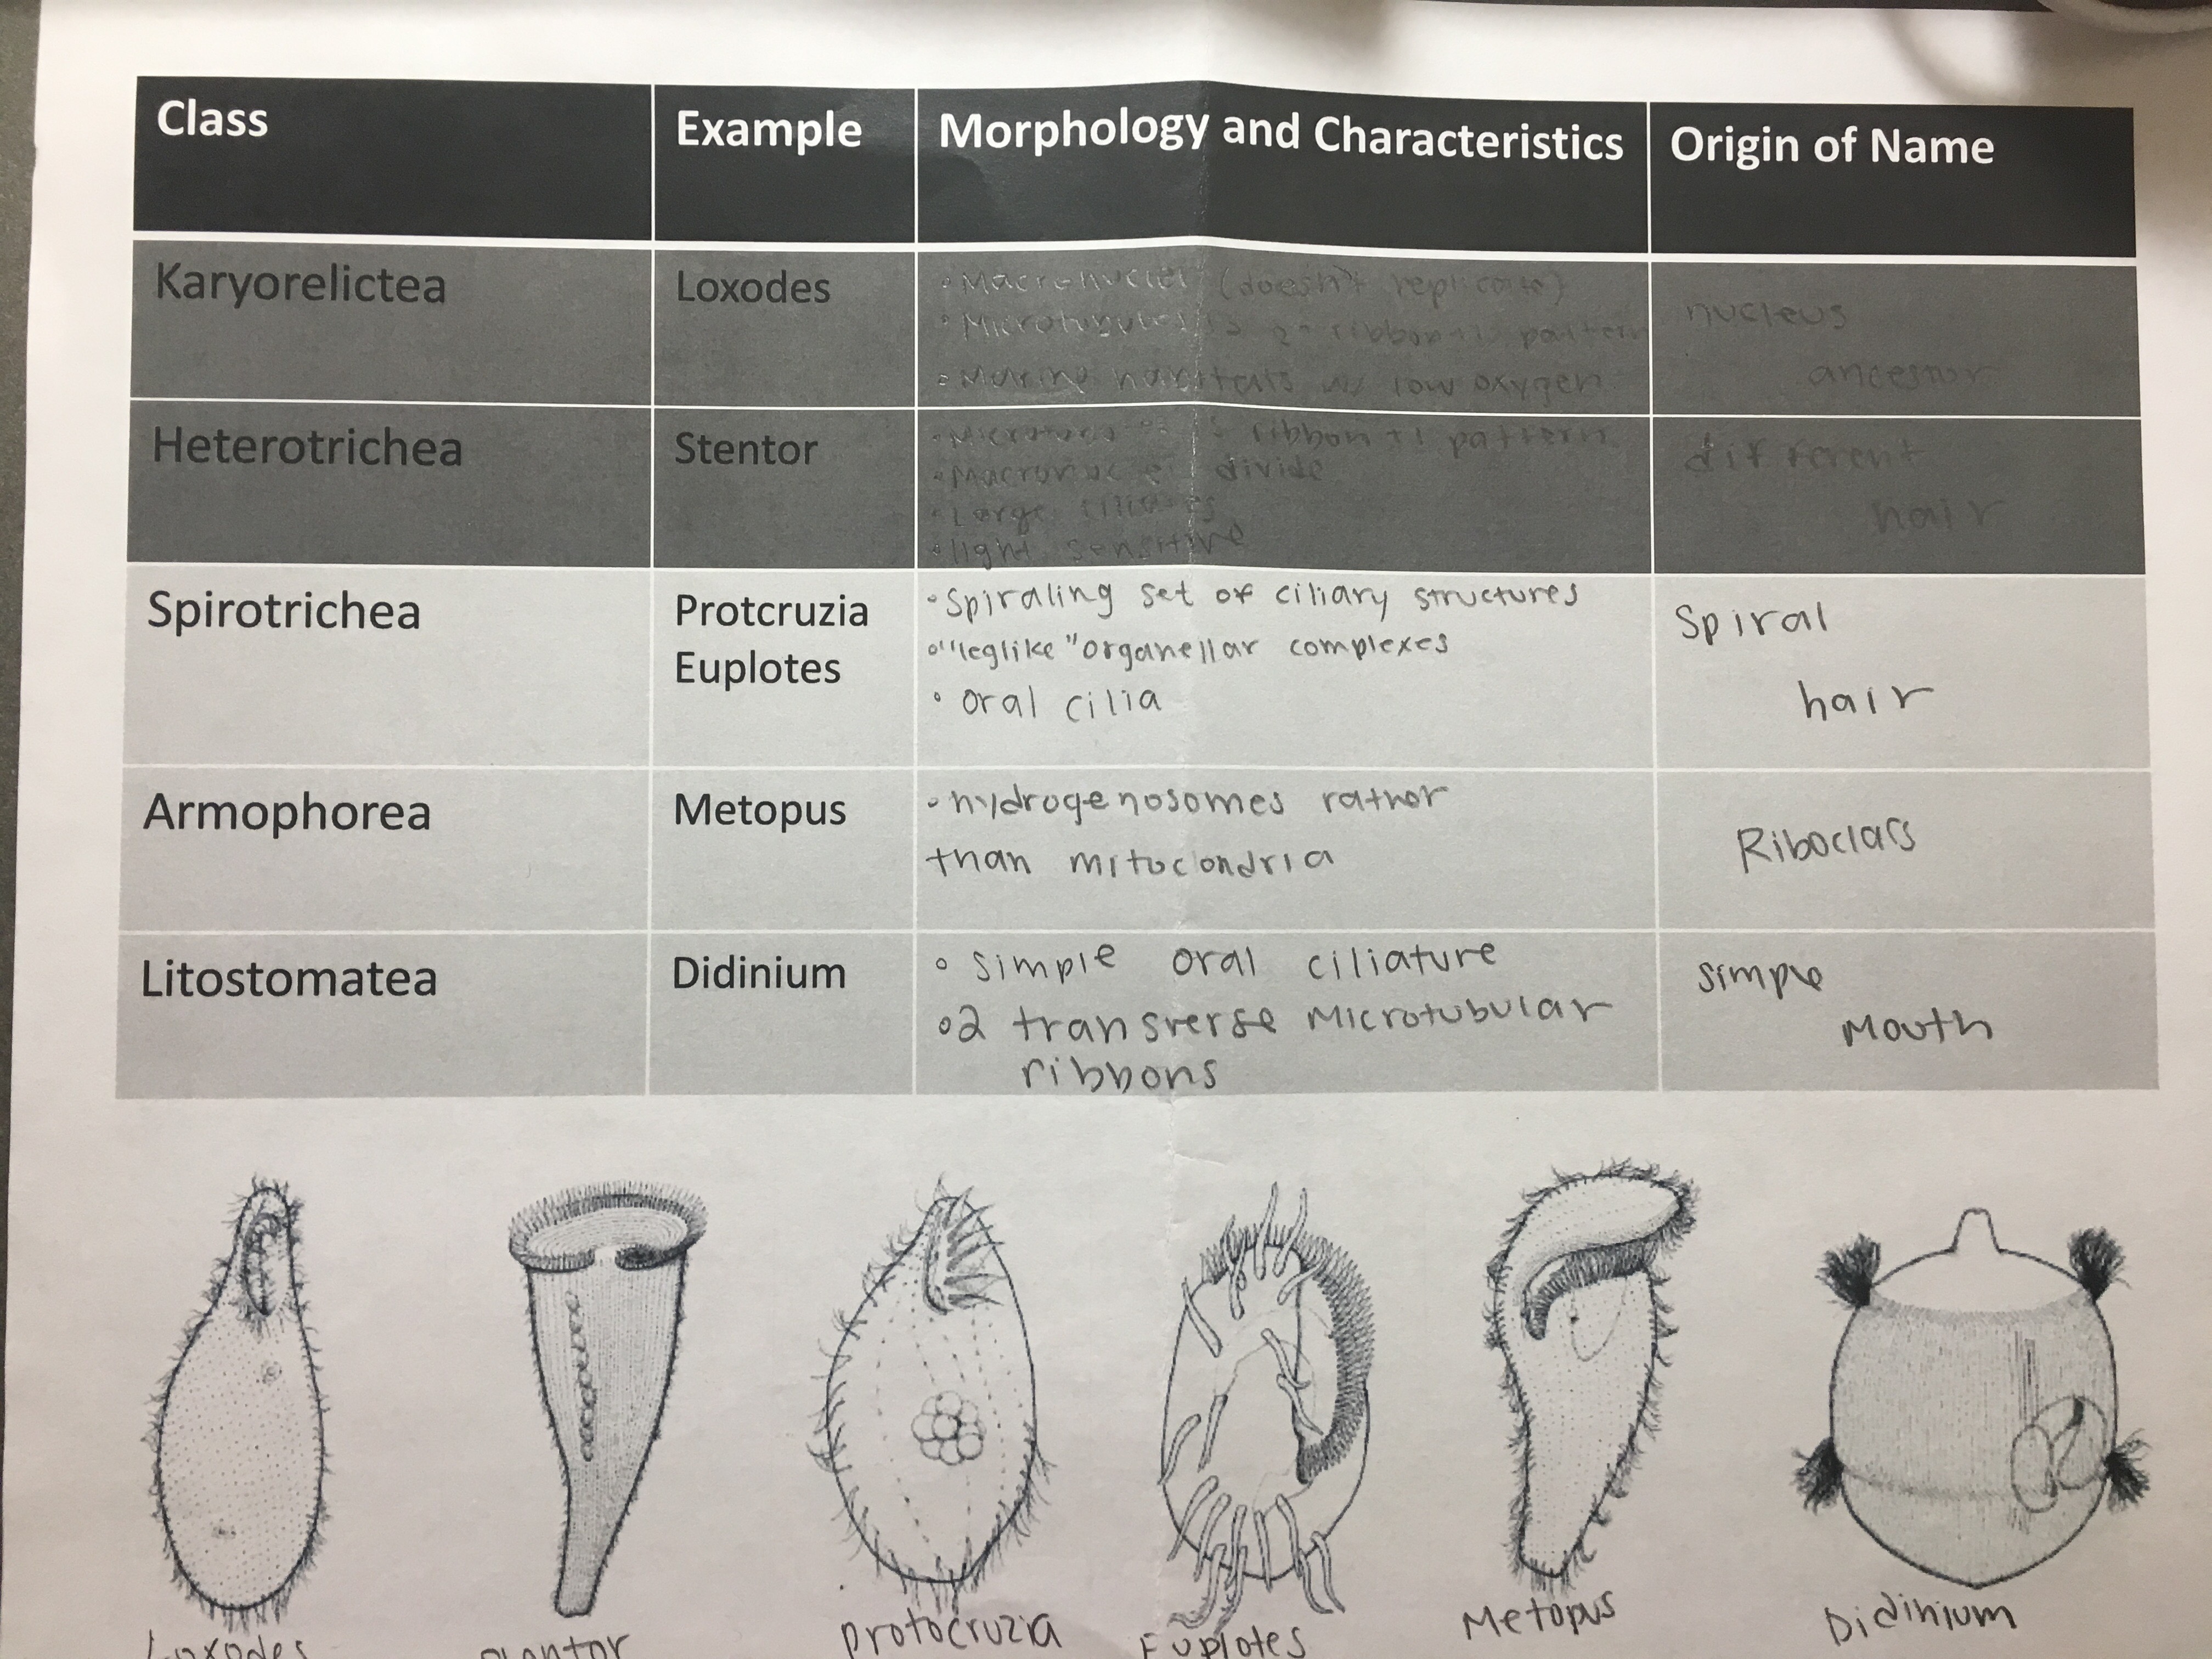
Conclusion: Overall, this experiment was an effective way to observe ciliates in different types of soil. Although I wasn’t able to capture ciliates from my soil, it was interesting to see the ciliates in Dr. Adair’s soil sample.

November 24

Lab experiment #12 (11/09/17)

Print Friendly, PDF & Email

Purpose: The purpose of this experiment was to find how much sand, clay, and silt was in our soil samples. After discovering the amount of sand, clay, and silt in our soil, we were able to determine what type of soil we collected.

Procedure:

  1. Obtain falcon tube that was created in the previous lab. You should be able to see different layers of silt, clay, and sand.
  2. Using a ruler, measure each layer to the nearest millimeter. Record information in your lab notebook.
  3. Measure the height of the soil.
  4. Divide the amount of silt by the height of the sample.
  5. Divide the amount of sand by the height of the sample.
  6. Divide the amount of clay by the height of the sample.
  7. Determine soil type using this chart:
  8. After determining your soil type, look for ciliates in your non-flooded plate.

Results:

Clay: (2mm/26mm) x 100=7.69%

Silt: (11mm/26mm) x 100= 42.31%

Sand: (13mm/26mm) x 100= 50%

Soil type: Loam

Conclusion: Overall, we were able to calculate the amount of clay, silt, and sand. By doing this we were able to determine the type of soil we collected at the beginning of the year. By doing this, it helped us realize how much of a variety of soil that we have on campus, and it could potentially tell us which soil ciliates are more commonly found.

November 14

Lab experiment #11 (11/02/17)

Print Friendly, PDF & Email

Purpose: The purpose of this experiment was to see how many ciliates were in the soil we collected in the beginning of the semester. Once we found ciliates in our soil we were supposed to create a culture.

Procedure:

Determining Water Content

  1. Get soil sample that was created at the beginning of the semester. The mass was previously recorded.
  2. Weigh the dry sample.
  3. Subtract the mass of petri dish.
  4. Calculate mass percent of water: [(wet soil)-(dry soil)/wet soil] x100

Determining Soil pH

  1. Place 3-4 mL of soil into a falcon tube.
  2. Add DI water to the tube until you reach the 8mL mark.
  3. Mix tube for a few minutes.
  4.  Let soil settle to the bottom, use a pipet to remove about 1 mL of water from the tube. Place it in a microcentrifuge tube.
  5. Put the microcentrifuge tube into a centrifuge and let it spin for approximately one minute.
  6. Obtain one strip of pH paper and a small glass bottle.
  7. Pipette the liquid from the microcentrifuge tube into the glass bottle.
  8. Place pH paper into the glass bottle.
  9. Use the pH kit to identify what the pH is.
  10. Record the pH.

Determining Soil Texture

  1. Remove any twigs or rocks from the soil sample.
  2. Add soil to 4 mL mark on a falcon tube.
  3. Add water to the tube until the 8 mL mark. Mix.
  4. Add one drop of dispersing agent to the falcon tube. Mix.
  5. Set tube aside for next week.

Non-Flooded Plate

  1. Add water to the petri dish from earlier in the semester. Add enough so the soil is moist and can slightly run off on the sides.
  2. Look at the petri dish under the microscope for ciliates. Observe the runoff part of the soil.
  3. Record ciliates that are seen.

Data:

Conclusion: Overall, this lab helped us learn various things. We learned about the pH of our soil, how to calculate water content, and how to create a Non-flooded plate. I think that we will be able to take these skills and apply them to future experiments.

November 13

Lab experiment #10 (10/26/17)

Print Friendly, PDF & Email

Purpose: The purpose of this experiment was to create a graph of my group’s data, then be able to present our data to the class. The graph is supposed to illustrate how many ciliates were killed from the Tetrahymena, while the instructors and other classmates give you feedback.

Procedure: My group and I presented the figure. We gave an overall summary of what we did including the procedure of our experiment and what our data meant.

Data:

This was my graph before I received feedback from the instructors and classmates. 


Recommendations from the instructors.

Updated figure

Conclusion: Overall, this experiment helped me get familiar with making charts and graphs on excel. It also helped me learn how to present these graphs, and what I should do next time I create a graph like this one.


October 19

Lab experiment #9 (10/19/17)

Print Friendly, PDF & Email

Purpose: The purpose of this experiment was to learn how to make a graph with our data from lab 7 on excel.

Procedure:

  • To make a bar chart you first open excel and add your data onto the program. Then, you select all of your data and click “insert” and “recommended charts.” Once you clicked “recommended charts” click on the bar chart.
  • To include the starting cell concentration, add a text box to write your starting cell concentration.
  • To add axis labels and a title, first click the chart. Then, click “chart design,” “add chart element.” Then, to add the axis click “axis titles” and you can choose to add a horizontal or vertical axis. To add the title click “chart title.”
  • To change the color of the graph, first click the chart. Then, click “chart design,” “change color.” Then, pick a color for your graph.
  • To add standard error bars, first click the chart. Then, click “chart design,” “add chart element.” After that, click “error bars,” “more error bars,” “custom,” “specify value.” After that, select both of your standard errors and add them into the positive and negative error value section.
  • To convert everything to log10, first click on an empty space on the excel home page. Then, write “=log10” into the empty space. After that, select your standard errors, and you will get your conversion.
  • To add an asterisk, create a text box onto your graph. In the text box write a “*” and the p value from your t test.
  • To save as a picture/jpg, right click your chart in excel and then click “save as picture.” From there, title your chart and save it as a JPEG.
  • To insert your chart into a word document, copy it from excel and paste it into a blank word document.
  • To add a caption in word, “click chart,” “references,” “insert caption.”

Data:

Figure from Excel

Figure from Word

Conclusion: Overall, using excel in class had helped me become more comfortable with making a graph and the calculations of my data.


October 19

Lab experiment #8 (10/12/17)

Print Friendly, PDF & Email

Purpose: The purpose of this experiment is to learn how to use excel and to make calculations through excel.

Procedure:

  1. Clean previous well plates from the previous lab.
  2. Go to computer lab.
  3. Download toolpak on excel.
  4. Perform histogram using results from pervious class.
  5. Perform T-test using results from pervious class.
  6. Perform F-test using results from pervious class.

Data:

Conclusion: Through this experiment I was able to get a better understanding of how to use excel. I also learned how to make calculations through excel.

October 14

Lab experiment #7 (10/05/17)

Print Friendly, PDF & Email

Purpose: The purpose of this experiment was to see the impact NH4Cl has on tetrahymena. The independent variable for this experiment was NH4Cl. Dependent variable was the impact NH4Cl has on tetrahymena population. Control was the tetrahymena solution without NH4Cl. In total, there should be 27 replicates per group, 9 per person.

Procedure:

  1. Pipette 450uL of PPT in 3 different wells.
  2. Pipette 50uL of tetrahymena into the 450uL of PPT in well 1.
  3. Place lid over plate and shake.
  4. Transfer 50uL of well 1’s solution into well 2. Shake.
  5. Transfer 50uL of well 2’s solution into well 3. Shake.
  6. Add 10uL of iodine to each well.
  7. Observe the tetrahymena under microscope, choose the dilution that will give you 10-30 cells in a 10uL drop.
  8. Dilute culture to 1000 cells/ml so there is enough for everyone in the group. 6mL per student.
  9. Determine class average by using C1V1=C2V2. Our class average was 247.
  10. Make dilution in a 50mL tube. Add 247uL of tetrahymena, then add PPT to the 20mL graduation mark. Mix.
  11. Add to 750uL of the solution made in step 10 to six wells.
  12. Add 250uL of NH4Cl to 3 of the well. This is the dependent variable.
  13. In the other three wells, add 250uL of DI water. This is the control.
  14. The next day, come back to lab to count tetrahymena in each solution.

Data:

Conclusion: Overall, this experiment further helped me with serial dilutions and micropipetting. Also, this experiment taught me how to do calculations such as C1V1=C2V2. This also helped me understand about how much tetrahymena lives in soil that has used fertilizer with NH4Cl.

October 14

Lab experiment #6 (9/28/17)

Print Friendly, PDF & Email

Purpose: The purpose of this experiment is to further explore serial dilutions to find concentration of cells per mL.

Procedure:

  1. Obtain 5 centrifuge tubes and label them -1 to -4.
  2. Add 90uL of media into the tubes.
  3. Add 10uL of tetrahymena to the tube labeled -1.
  4. Add 10uL of tube -1 to tube -2.
  5. Repeat step 4 for the rest of the tubes by adding 10uL from the previous solution into the next tube.
  6. Place 5uL from each tube onto a concavity slide.
  7. Count the number of tetrahymena from each tube on the slide and record observations.
  8. Decide which tube was the best and place three more 5uL drops onto the concavity slide.
  9. Count the tetrahymena and record observations.
  10. Do calculations using standard deviation.

Data:

Conclusion: After we finished this lab, I have become more comfortable performing serial dilutions and micropipetting solutions. One error that my group and I did was that instead of using the media, we used water. This impacted our overall data.

October 7

Lab Experiment #5 (9/21/17)

Print Friendly, PDF & Email

Purpose: The purpose of this experiment is to get comfortable with serial dilutions.

Procedure:

  1. Label 5 microcentrifuge tubes from 0 to -4.
  2. Add 10uL of the sample into the first tube that is labeled 0.
  3. Add 90uL of media to the tubes labeled -1 to -4. Do not add to the tube labeled 0.
  4. Add 10uL to the tube labeled  -1. Vortex the tube for 10 seconds to mix the sample.
  5. Add 10uL from the tube labeled -1 to the -2 tube. Vortex the tube for 10 seconds.
  6. Repeat step 5 for the rest of the tubes by adding 10uL from the previous solution into the next tube. Then vortex.
  7. Place 5uL of each sample onto a concavity slide.
  8. Place the slide under a microscope and observe.
  9. Observe and count how many cells are in each dilution sample. Record observations.

Results:

Conclusion: Overall, students that participated in this lab were able to learn more about serial dilutions. I personally thought that this lab was really interesting to do because we got to see how cells react when living in the same samples, but different dilutions.