Lab experiment #10 (10/26/17)

Purpose: The purpose of this experiment was to create a graph of my group’s data, then be able to present our data to the class. The graph is supposed to illustrate how many ciliates were killed from the Tetrahymena, while the instructors and other classmates give you feedback.
Procedure: My group and I presented the figure. We gave an overall summary of what we did including the procedure of our experiment and what our data meant.
Data:
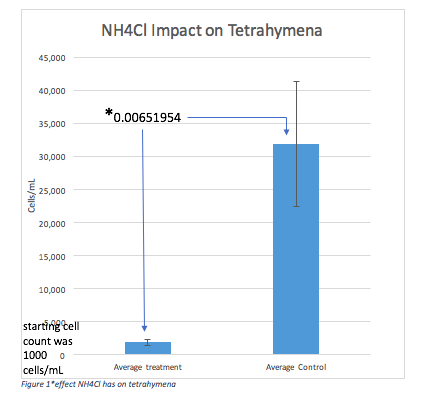
This was my graph before I received feedback from the instructors and classmates.
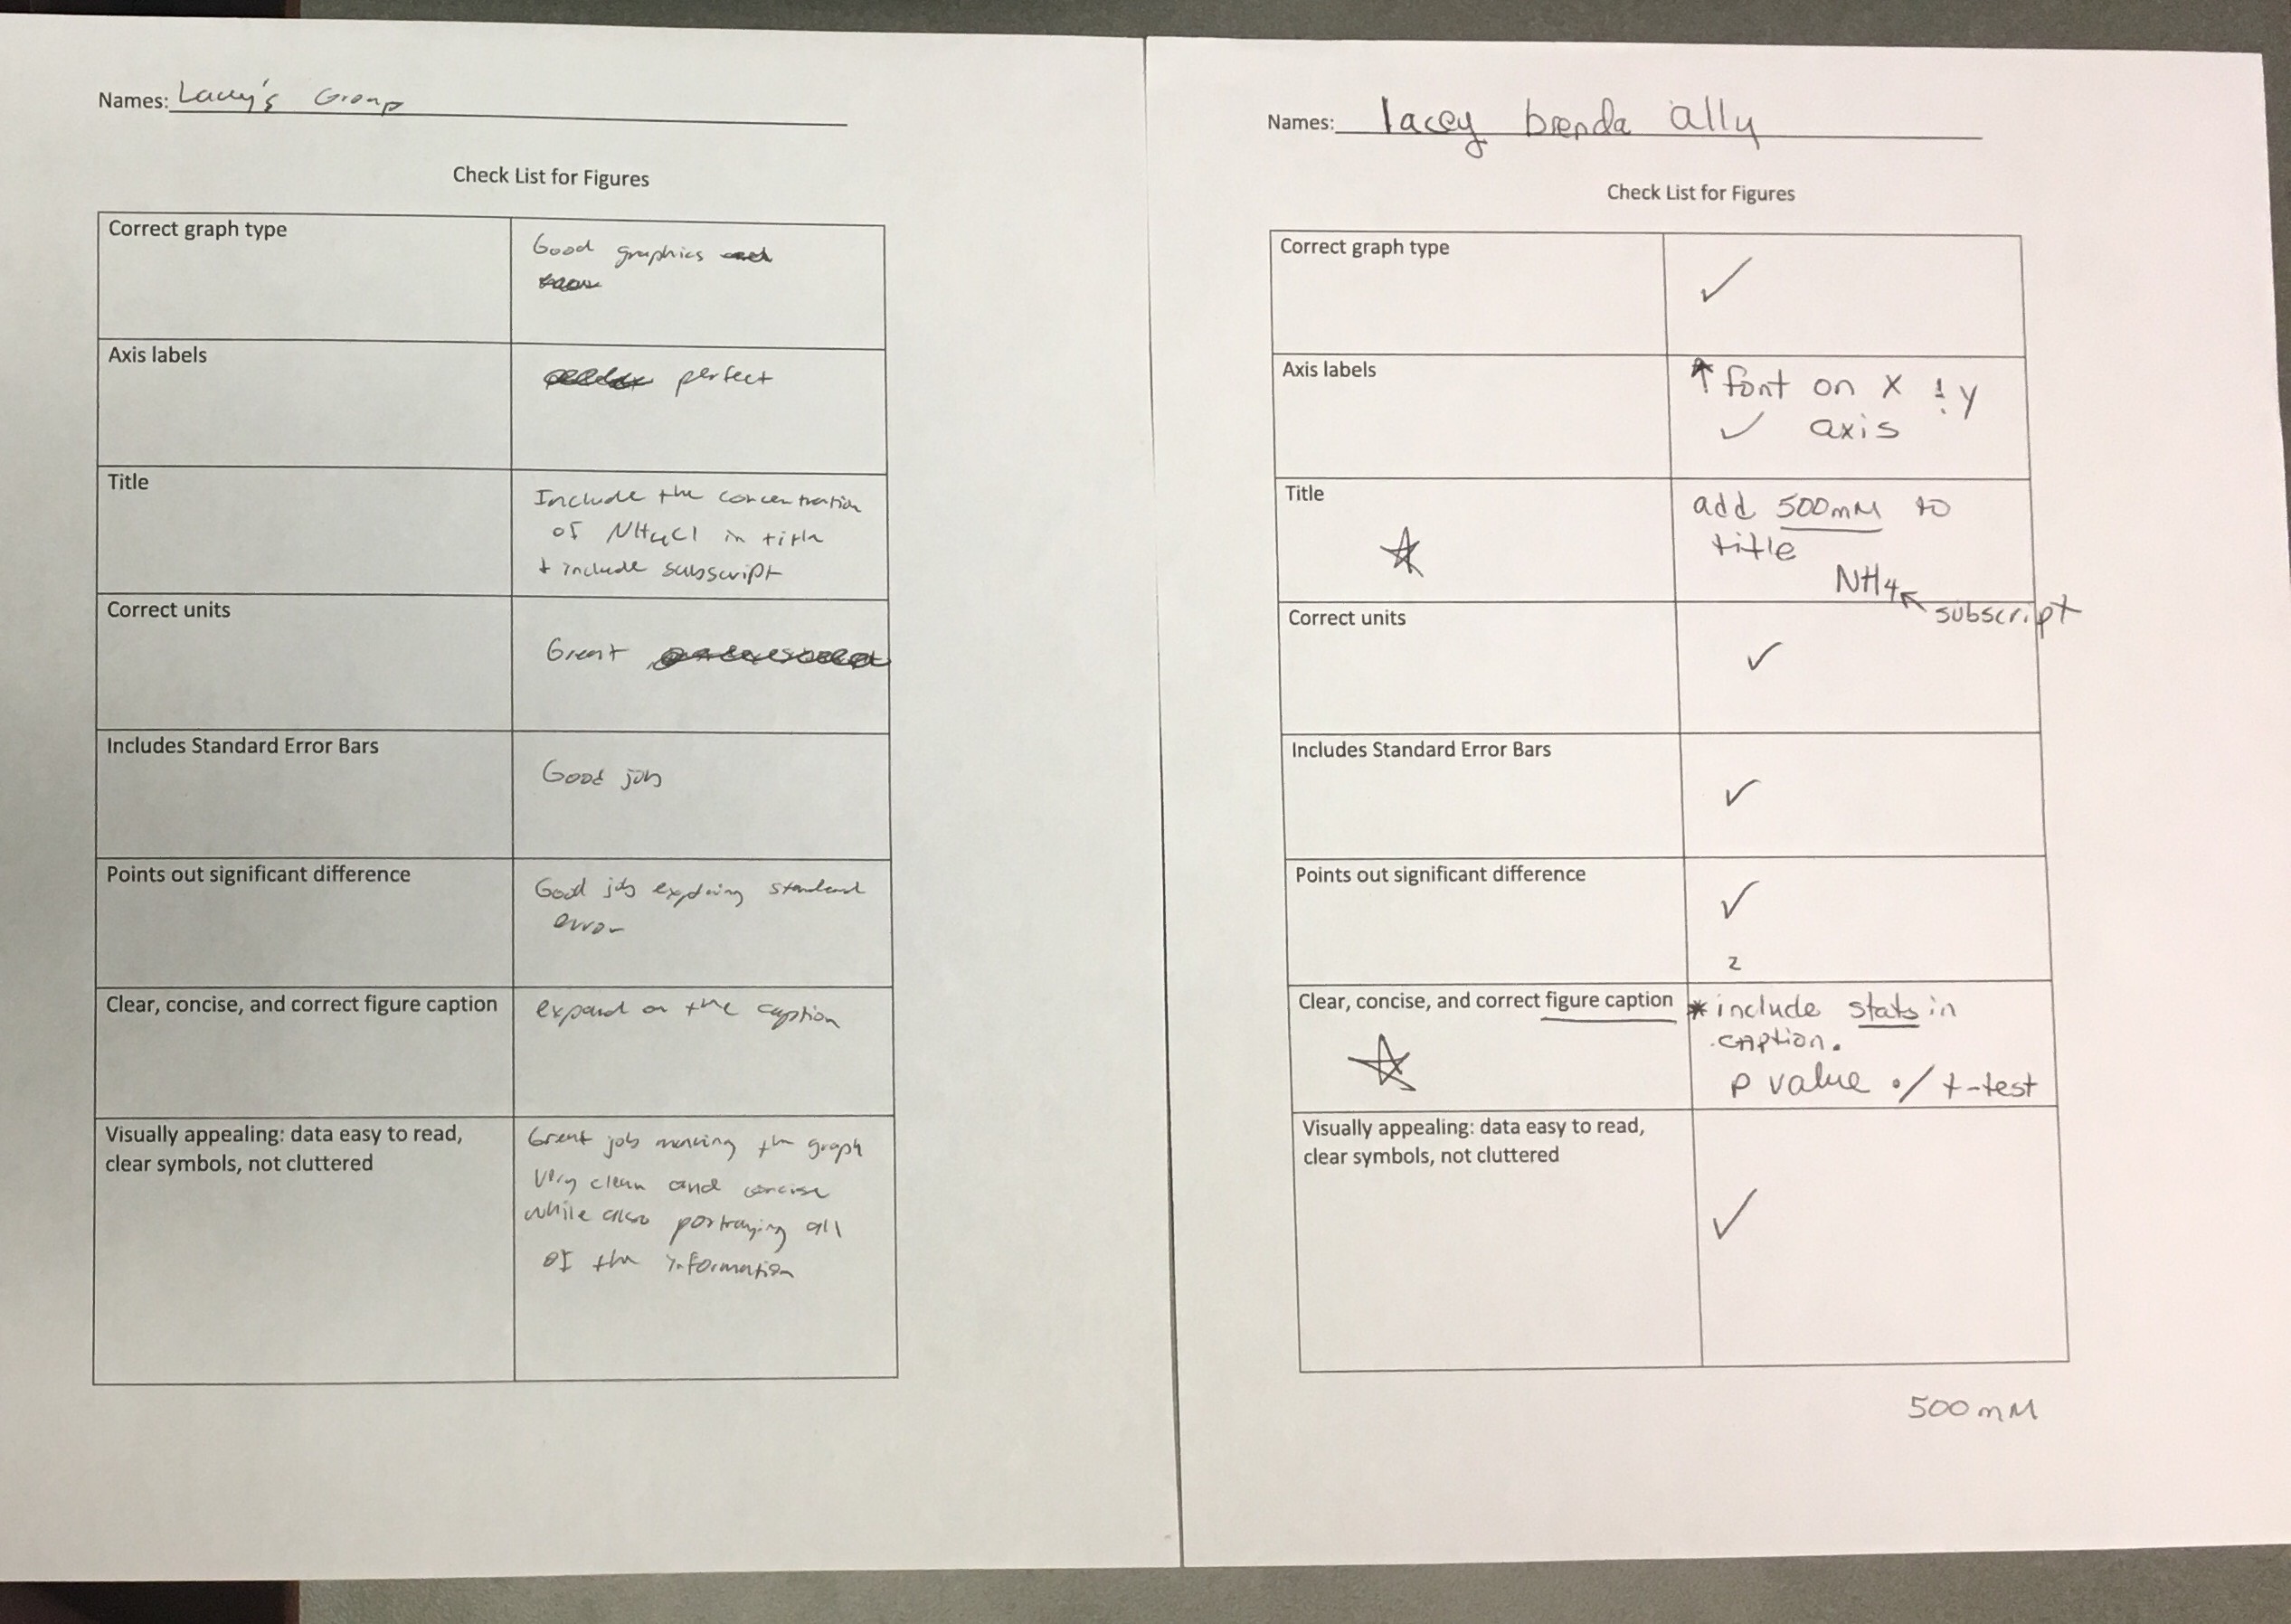
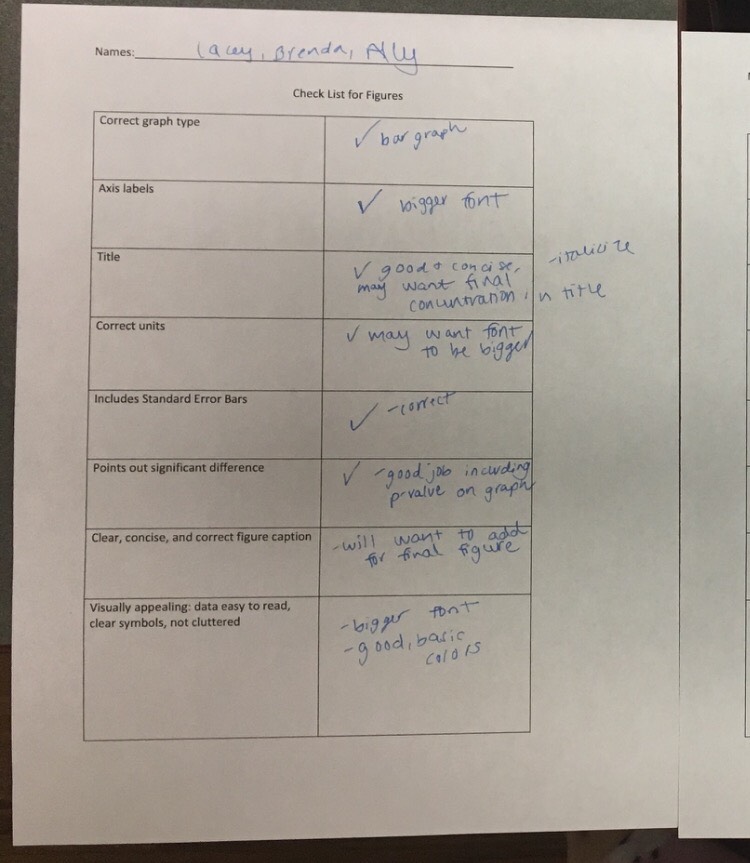
Recommendations from the instructors.
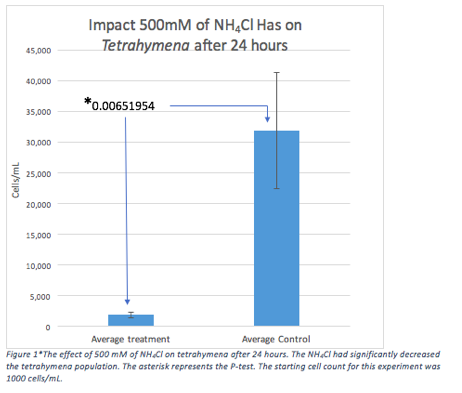
Updated figure
Conclusion: Overall, this experiment helped me get familiar with making charts and graphs on excel. It also helped me learn how to present these graphs, and what I should do next time I create a graph like this one.