November 24

Lab #13 Pick, Culture, and Characterize

Print Friendly, PDF & Email

Lab #13

11/16/2017

Purpose: The purpose of today’s lab is to search for ciliates in the non-flooded plates and place them in Protozoa Pellet Media in a clean culture plate for observation. Stain and photograph any ciliates that are found.

Procedure:

  1. Stain and photograph any ciliates that have grown in your culture plate.
  2. If your ciliates died or you were unable to find any, adopt a sample from the Bermuda plant.
  3.  Use the camera in the lab to record a video or take pictures of your ciliate.
  4. Record all data in your notebook.

Data/Observations:

Two organisms were found. The first one was very long and skinny and very hyperactive. The second one was short and oval-shaped and swam at a slow pace in the media.

Video of Organisms, taken using Camera Microscope in Lab

IMG_3569.TRIM-2mer40k

IMG_3572.TRIM-276je1m

Conclusion: The technology used in lab was very useful in producing important pieces of data that will be used in our presentations. The next step in our lab is to create a short presentation about the ciliates that were found.

November 24

Lab #12 Soil MetaData

Print Friendly, PDF & Email

Lab #12

11/9/2017

Purpose: The purpose of this lab was to find the percent composition of our soil samples that were collected during week 1 and hopefully isolate a ciliate for later study.

Procedure:

  1. Obtain falcon tube containing soil sample and water. At this point, the sample should have separated into noticeable layers of clay, silt and sand.
  2. Using a ruler, measure each of the layers to the nearest mm and record the information in your lab notebook and add this info to your soil data sheet online.
  3. Calculate the percent composition of clay, silt and sand by dividing each of the perspective heights by the total height of the sample.
  4. If there is still time, search for ciliates in the non-flooded plate and place them in Protozoa Pellet Media in a clean culture plate for later observation. Make sure to take pictures.

Data/Observations:

Sand: 8/19 = 42.11%

Silt: 7/19 = 36.84%

Clay: 4/19 = 21.05%

Soil Type: Clay Loam

Conclusion: This activity was very useful in determining what kind of ciliate lives in certain soil types. The next step in our lab is to isolate a ciliate and classify it for later study.

November 5

Lab #11

Print Friendly, PDF & Email

Lab #11

11/2/17

Purpose: The purpose of this lab activity is to determine the soil ciliate biodiversity within the soil samples collected earlier in the semester. Techniques such as determining soil water content, preparing a non-flooded plate, finding soil pH, will help us discover ciliate abundance and diversity.

Procedure

Determining % Soil Water Content

  • Remove soil samples from drawers
  • Weigh the samples and calculate the mass of the water that has evaporated from the soil
  • Convert this to a percent
    • Wet soil – dry soil / wet soil x 100 = %water
  • Add information to the Soil Data Sheet

Soil pH Protocol

  • Place about 3 mL of soil in a labeled 10 mL Falcon tube and fill to the 8mL mark with DI water. Mix for 3-5 minutes and let soil settle to the bottom.
  • Remove about 1 mL of liquid from the top of the tube and transfer it to a microfuge tube.
  • Spin the tube in the centrifuge for 1 minute to pellet the soil.
  • In order to test the pH of the soil, remove a small strip of pH paper and place it in a clean glass tube. Add the clear soil water so that you submerge the strip.
  • Wait 1 minute and record the result after comparing the color. If your result is on either end of the scale, you can use another range of paper to test below 5 or above 9.
  • Record the pH in your notebook.

Determining Soil Texture

  • Remove the sticks and leaves from the soil sample
  • Add soil to about the 4mL mark in a Falcon tube
  • Add water and mix vigorously
  • Add 1 drop of dispersing agent and remix
  • Observe the tube after 30 seconds. The sedimentation of sand particles will have occurred
  • Let the tube sit undisturbed overnight or until the next lab.
  • Use a ruler to measure the %sand, silt, and clay. This procedure works best by taking a clear picture of the tube and zooming in on the sedimentation lines
  • Determine the % of each type of soil particle
  • Record your findings in your notebook.

Non-Flooded Plate

  • Put 10-50g of air dried soil in a petri dish with enough to cover the bottom of the plate on one side.
  • Saturate but don’t flood the sample with DI water. Add water until about 5mL of water will drain off when the petri dish is tilted.
  • Observe the soil using a dissecting microscope.
  • Use the micropipette to remove 100 microliters of liquid sample. Transfer this to a concavity slide to observe and further isolate. Record the number of ciliates observed.
  • Isolation may be done by serial dilution if there is more than one type of ciliate in the sample.
  • Once you have captured a ciliate, transfer it to 500 microliters of media in a clean 24 well plate.
  • Keep the lid on the non-flooded plate to decrease evaporation but still allow airflow and gas exchange.
  • Continue to check on the plates.

Data & Observations

Soil Water Content

Initial Mass: 23.4 g

Final Mass: 22.1

Mass of Petri Dish: 11.3 g

Soil Water Content: 10.74% water

pH of Soil: 6.5

Non-Flooded Plate Observations after 24 hours

  • No ciliates were found under the dissecting microscope. The ciliates may still be in the insisted/ hibernating state because of drying phase of soil preparation.

Conclusion: This lab was meant to prepare our soil for examination for ciliates. I am very excited to see where this lab will take us because the possibility of finding a new type of ciliate is very encouraging. The next steps in this lab is to continue to make observations on the non-flooded plate and tube. My work was labeled AJR34F17 and stored until the next lab.


October 27

Lab #10 Figure Feedback

Print Friendly, PDF & Email

Figure Feedback

10/26/17

Purpose: The purpose of this activity was to present our figures to the class, receive feedback, and make revisions to our rough draft figures and reports.

Procedure:

  1. Present your figure to the class.
  2. Receive feedback and take note of any suggestions for improvement.
  3. Make any necessary changes and submit your rough draft along with your figure to Dr.Adair.

Data:

Changes Made:

  • The Y-Axis label was changed to cells/mL
  • The title was changed to include the treatment of 150mM on Tetrahymena
  • Any significant differences on the graph was discussed in the caption
  • The actual P-Value was added to the graph.
  • The caption was more descriptive and clear

Conclusion:

This lab was very helpful in teaching us the right way to present our data to the class for our lab report. The next step in the process is to refine our rough draft according to feedback from Dr. Adair and the TA’s.

October 19

QTM #9

Print Friendly, PDF & Email

QTM #9

10/19/2017

Purpose: The purpose of this lab activity was to become more acquainted with using Excel and produce a clear and informative graph that conveys the message lying behind our data. The figure must include the data from the entire treatment group and this will be presented for feedback.

Procedure:

  1. Make a bar chart (or any other chart that would represent the data better)
    1. Make a table of the treatment and control values.
    2. Find the average values for the control and treatment values and place these numbers in a separate column.
    3. Create a bar graph by clicking on recommended charts.
  2. Add axis labels and a title by clicking on chart design and add chart elements.
  3. Change the colors of the graph by clicking on change colors.
  4. Add Standard Error Bars.
    1. Click on add chart elements – error bars – standard error.
    2. You may have to also perform a new data table to find the standard error.
  5. How to add an asterisk to point out significant differences.
    1.  Insert a text box and use the data from the T-Test to determine if we were able to refute the null hypothesis. Because the P-value was less than 0.05, we were able to reject the null hypothesis.
  6. Save the work as a picture in the form of a jpeg.
  7. Insert into your report.
  8. Add a caption to your figure in Word.

The figure above shows the average values for the treatment and control cell counts. The standard deviation, as calculated previously, is also shown in the bar graphs.

October 12

Excel & Data Analysis

Print Friendly, PDF & Email

Lab 8: Excel & Data Analysis

10/12/2017

Purpose: The purpose of this activity was to learn how to use Excel Data Analysis ToolPak. Using Excel, we found the mean, standard deviation, make histograms, conduct the F-Test, and conduct the T-Test.

Procedure:

  1. Use a filter to find the information of your partners. Our group had a final treatment mM of 150.

2. Use the descriptive statistics function to find the mean and standard deviation of the data.

3. Using the ToolPak, make histograms of your data.

In the lab, I was unable to produce a histogram for my data. Even with Dr. Adair’s help, we were, for some reason, unable to make a histogram of my data.

4. Perform the F-Test.

5. Perform the T-Test.

Conclusion: Although this lab was very time-consuming and quite frustrating, it was really great learning how to use Excel, a widely used program for data analysis. Excel is very useful in managing a large set of data and finding statistical answers such as the mean and the standard deviation. Excel is also very useful in determining whether to reject or accept the null hypothesis, based on the results of the F and T Tests. In the near future, I hope to become better at using Excel.

October 12

Lab #7

Print Friendly, PDF & Email

Toxicity Assay

10/5/17

Purpose: The purpose of this activity was to begin our experiment that we will conduct for the semester. Section 1105-34 will be testing the affects of NH4Cl  on tetrahymena survival. NH4Cl, a common component of fertilizer is very relevant in our study of the affects of toxicants in the soil environment.

Procedure:

  1. Pipette 450 microliters of PPT into 3 wells.
  2. Pipette 50 microliters of well-mixed stock culture into the 450 microliters of PPT media in well 1.
  3. Mix gently.
  4. Transfer 50 microliters of 1:10 dilution into the 1:100 well. Mix.
  5. Transfer 50 microliters of 1:100 dilution into the 1:1000 well. Mix.
  6. Observe Tetrahymena in each well and choose the dilution that will allow you to count between 10-30 cells in a 10 microliter drop.
  7. Dilute the culture to 1000 cells/mL making enough culture for each person in the group to use about 6 mL.
  8. Obtain solution with treatment of 75 treatment of NH4Cl.
  9. Make the dilution in a 50 mL test tube. Add the required amount of stock culture and add PPT media to the 20 mL graduation mark on the tube.
  10. Add treatment to the culture and dilute the culture and be sure to add an equal amount of water to the control wells.
  11. Record all observations and safely store your plate for future observation.
  12. Return to lab to count cells.
  13. Add 20 microliters of iodine to each well and take 3 cell counts for each well using 10 microliter drops.
  14. Record counts in cells/mL on the spreadsheet.

Observations/Data

Average cell count: 17 cells

Count per microliter: 1.7

Dilution factor: 1:100

Cells/microliter: 170

Cells per mL in stock : 170,000

Average : 81,118

Standard Deviation: 64,396


Average cells per mL 1 Treatment : 1067

Average cells per mL 2 Treatment : 1400

Average cells per mL 3 Treatment : 766

Average cells per mL 1 Control : 8660

Average cells per mL 2 Control : 9330

Average cells per mL 3 Control : 5000


Conclusion: We collected data as a class and are ready to begin our experiments. The different groups in the class have different treatments and an overlying conclusion will be formed once all experiments have finished.

October 5

The Ciliate Count Challenge

Print Friendly, PDF & Email

The Ciliate Count Challenge

9/28/2017

Purpose: The purpose of this lab activity is to use the tetrahymena culture to determine the concentration of the sample in cells/mL. Practicing using micropipettes and performing serial dilutions was also a key part in this lab activity. Once the concentration was determined, the replicate, mean, and standard deviation is to be reported. After this, is finished the minimum amount of 1M solution of NaCl that will cause an immediate effect on Tetrahymena was determined. Tetrahymena behavior and survival were observed.

Procedure:

  1. Label 5 microcentrifuge tubes 0, -1, -2, -3, -4 and place them in a tube rack.
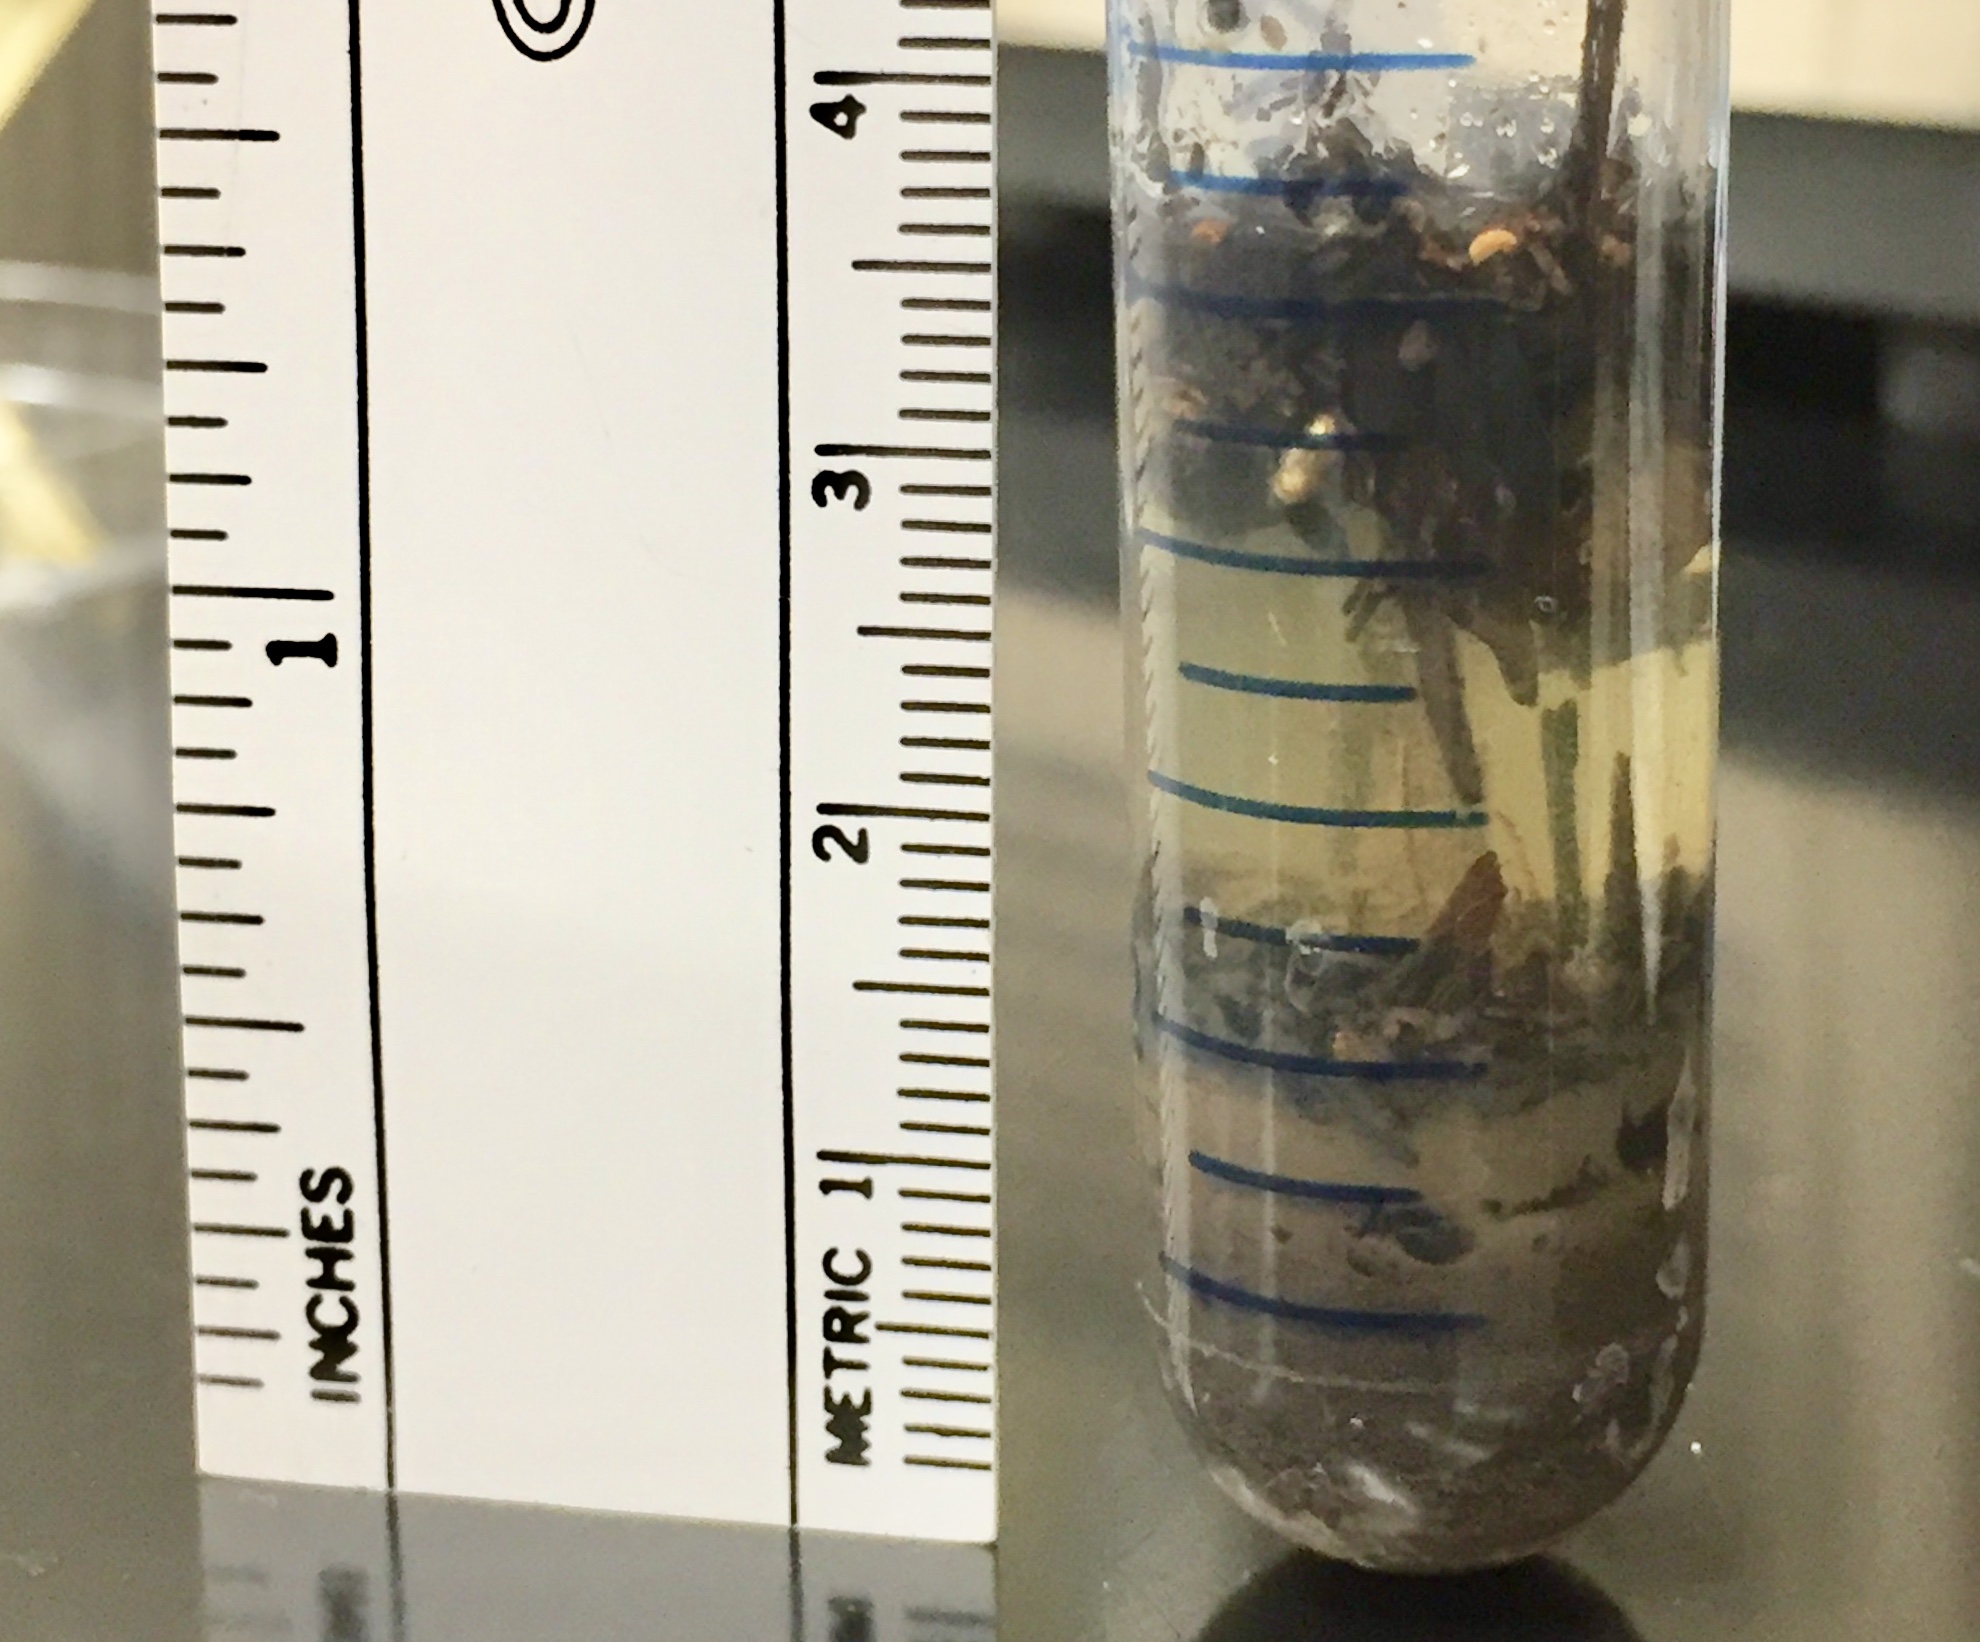
  2. Add a small amount of your sample to the tube marked 0- this is the undiluted sample.
  3. Add 90 microliters of diluent to each of the test tubes.
  4. Add 10 microliters of undiluted sample to the -1 tube and vortex briefly.
  5. Add 10 microliters of -1 sample to -2, vortex, and repeat for the rest of the tubes.
  6. Observe 5 microliters of each tube under a compound microscope and estimate the number of cells.
  7. Determine the average cell count in 5 microliters, average cell count per microliter, average cells per microliter in the undiluted sample, and the average cells per milliliter in the undiluted sample.
  8. Use the dilution with about 15-30 cells for your observations. Observe this dilution 3 times and calculate the mean cells per microliter.
  9. Using this same dilution, determine the minimum amount of 1M NaCl that the tetrahymena can withstand.
  10. Record all observations in the lab notebook.
  11. Clean up properly and return all samples and equipment to the proper place.

Observations

Dilution

Average cell count/ 5 microliter

Average cell count per microliter

Average cell count per microliter in undiluted sample

Average cells/mL in undiluted sample

0

37.5

7.5

57.5

7500

10^-1

25.66

5.13

51.33

51,333.33

10^-2

2.67

0.533

51.33

51,222.33

10^-3

2.33

0.467

467

467,000

10^-4

0

0

0

0

10^-1 average = 5.13 cells per microliter

This dilution was used for the 1M NaCl part of the lab.

5 microliters of Tetrahymena at 10^-1 dilution were tested with differing amounts of 1M NaCl. The following observations were made.

5 microliters = Immediately dead

3 microliters = Immediately dead

1.5 microliters = Immediately dead

0.75 microliters = Alive

Therefore, it was determined that the minimum amount of 1M NaCl that 5 microliters of Tetrahymena can withstand was 0.75 microliters.

Conclusion: This activity was very useful in furthering my micropipette and serial dilution skills. The information regarding the minimum amount of 1 M NaCl that tetrahymena was able to withstand is very useful in formulating our experiment. The next step in this lab is to use this information and go forward to see how an ammonium chloride solution will effect the tetrahymena culture.

September 28

The Ciliate Count Challenge

Print Friendly, PDF & Email

The Ciliate Count Challenge

9/28/17

Purpose: The purpose of this activity is to practice performing serial dilutions and using micropipettes to determine the concentration in cells/mL. After counting the cells, use the information to report the mean and standard deviation among the counts of your peers.

Procedure:

  •  Using media and Tetrahymena culture, make a 1:10 dilution series to a 1:10,000 in labeled microfuge tubes.
  • Add a small amount of your sample to the tube marked 0-.
  • Add 90 microliters of diluent to each of the rest of the tubes.
  • Add 10 microliters of undiluted sample to the 10^-1 tube and mix.
  • Add 10 microliters of 10^-1 sample to the 10^-2 tube and vortex. Repeat for each tube.
  • Place a 5 microliter drop of each solution on a concavity slide and count the number of cells at 4x power.
  • Report the replicate, mean, and the standard deviation.
  • Use the 1M solution of NaCl to make dilutions and determine the minimum amount of NaCl that will cause an immediate effect on the Tetrahymena.
    • Differing amounts of 1M NaCl was added to 5 microliters of tetrahymena culture.

Observations:

10^-1 Average cell count per microliter = 5.8 cells per microliter

Average cells per microliter in undiluted sample = 58 cells

Average cells per milliliter in undiluted sample = 58,000 cells

The following amounts of 1M NaCl were added to 5 microliters of Tetrahymena culture and the following observations were made.

5 microliters = All tetrahymena died immediately.

3 microliters = All tetrahymena died immediately.

1.5 microliters = All tetrahymena died immediately.

0.75 microliters = Tetrahymena survived for about 3-4 minutes then died.

Conclusion:


September 27

Lab 5: Serial Dilutions & Micropipetting

Print Friendly, PDF & Email

Serial Dilutions & Micropipetting

9/21/2017

Purpose: The purpose of this activity was to learn how to use a micropipette as well as learn how to use serial dilutions to estimate the number of cells in a given solution.

Procedure:

  • Using media and the Tetrahymena culture, make a 1:10 dilution series to a 1:10,000 dilution in labeled microfuge tubes.
    • A 1:10 dilution is 10 microliters of tetrahymena into 90 microliters of media.
  • Use the serial dilution procedure to create a 1:10,000 dilution.
  • Be sure to place 10 microliters of each solution into each descending tube and don’t forget to mix the solution after adding the 10 microliters.
  •  Place a 5 microliter drop of each solution on a concavity slide and count the number of cells at 4x power under the compound microscope.
  • Find the dilution that has an easily countable number of cells (about 10-20) and repeat this procedure 3 times to ensure accuracy.
  • Use the equation : Average cells in 5 microliters/ dilution factor x 1000 microliters = x cells/mL

Observations:

Zero = Too many cells to count

10^-1 = 38 cells

10^-2 = 16 cells

10^-3 = 3 cells

10^-4 = 1 cell

Conclusion: Learning how to use micropipettes and how to perform serial dilutions is crucial for laboratory activities. Counting cells in a solution will be very helpful for our future experiments. For example, it would not be possible to determine the effect of a toxicant if one was unable to determine how many cells were killed or how many survived. The next step for our lab is to begin our tetrahymena experiments.