November 18

Presentation Feedback on Graphs (10/26/17)

Print Friendly, PDF & Email

Presentation Feedback

Purpose: The purpose of this lab was to present our figures to the class and to receive feedback from Taylor and Dr. Adair to make our graphs better and more understandable.

Procedure:

  1. First, upload your figure to Canvas so it can be pulled up for the presentation.
  2. Describe your graph to the class in detail.
  3. Listen to the feedback you are given and correct any mistakes.

Results: After presenting our graph to the class and discussing our findings and what we included, we received feedback. The main problem with our graph was that we did not incorporate the sample size and the title could have been more detailed in order for readers to understand what they are looking at on the graph. After changing our graph, it can now be better understood.

Below is the first graph we made, and the second graph shows our corrections of the title. We also corrected the information below the figure so it was more detailed and better understood of what was going on in the figure.

Conclusion: This lab was designed to help us change and better our graphs for the research paper that we will turn in in the next couple of weeks. The feedback given to me on my figure has helped me alter the title and information beneath the picture. This feedback can also help me in making my other graphs, as I will now include all that is needed and refer back to my new figure and the notes that I was given. This lab period was also a great way to practice presenting information, as we will also complete a presentation at the end of the semester.

November 16

Lab #13: Finding Ciliates and Further Ciliate Classification (11/16/17)

Print Friendly, PDF & Email

Finding Ciliates and Further Ciliate Classification

Purpose: The purpose of this lab was to discover more ciliates in the culture and the petri dish and to take pictures of them to later determine what class it is in.
Materials: 

  • Methyl cellulose
  • petri dish
  • camera
  • compound microscope
  • micropipette
  • PPT
  • 24 well plate

Procedure:

  1. Take out your labeled petri dish and 24 well plate.
  2. Place 5 uL of the clear water from the soil or the 24 well plate and place it on a concavity slide to put under a compound microscope.
  3. Look for any ciliates that may be in your sample. If you cannot find any, try another sample.
  4. Once a ciliate is found, take your concavity slide with your sample on it to a compound microscope connected to a camera.
  5. Find your ciliate and use the highest magnification possible.
  6. Once the image is clear, take several pictures of your ciliate for the presentation in the following class.
  7. After getting pictures of the ciliate, culture it with 1000 uL of PPT to see if any other ciliates will reproduce.

Methods & Materials:

In this lab, I discovered a moderately large ciliate from my petri dish. It was long and clear. It ran around very quickly, so I added methyl cellulose to the sample and it slowed the ciliate down. At a 100x magnification, I was able to see the cirri on the ciliate and other interesting characteristics. I discovered that it was a holotrich because the surface was uniformly covered. Below are pictures of ciliate I found and the soil it came from.

In this picture of the ciliate, you can also see the cirri at the end of it and in the oral grove. This shows it as a heterotrich as well.

This is a picture of my non-flooded plate where I found my ciliate from. My soil was was very rich in ciliates and many were found in here that were different shapes and sizes.

Below is the chart that classifies all of the ciliates and shows examples, morphology, characteristics and origin of name.

Conclusion: 

This lab allowed me to understand how diverse ciliates are. After viewing several different characteristics and morphologies of ciliates, I can now attempt to identify the class that it is in. As of now, I believe that the ciliate is a Metopus, but I could possibly be incorrect. There are over 8000 different species of ciliates, thus, it is very difficult to place ciliates in the correct class. The goal is to be persistent, because failure is inherent and it could mean something if you fail. By taking pictures of the ciliate I found and listing all of its characteristics, this ciliate can be classified by looking at various aspects. This lab helped me to prepare for what I should discuss in my presentation for the next class period.

November 14

Lab #12: Soil Collection and Ciliate Capture (09/10/17)

Print Friendly, PDF & Email

Ciliate Capture and Culture

Purpose: The purpose of this lab was to look at our soil from the petri dish sample and find any ciliates in the soil to take out and culture in order to classify that ciliate.

Procedure: 

Part One: Determining Soil Measurements

  1. Take your falcon tube and make sure that the sand, silt and clay are all separated with three distinct layers.
  2. Take a ruler and measure each of the three layers as well as the the entire measurement of all three layers together.
  3. After measuring the different layers, divide the measured layer by the total and multiply by 100 to get the percentage of clay, silt and sand in your sample.

Part Two: Ciliate Capture

  1. Take your non-flooded plate and add some droplets of water to it with a pipette if the soil dried out.
  2. Take a micropipette and carefully take out 5 uL of clear water from the petri dish to place on a glass slide and put it under a compound microscope.
  3. Look for any ciliates in your sample.
  4. If ciliates are found, take place that sample in a well along with 500 uL of media to allow for further growth of the ciliates.

Materials:

  • Falcon tube
  • Ruler
  • 24 well plate
  • Glass slide
  • Compound microscope
  • Petri dish
  • Soil Sample
  • Media
  • Micropipette
  • Distilled water
  • pipette

Data & Observations:

Soil Measurement:

The total measurement for all three layers was 2.6 centimeters. The sand was the bottom layer and it measured to be 0.9 cm. The silt was the middle layer and it was 1.5 cm, and the clay was the top layer and it measured to be 0.2 cm.

Sand: 0.9/2.6 x 100= 35%

Silt: 1.5/2.6 x 100= 58%

Clay: 0.2/2.6 x 100= 7%

Image

Ciliate Capture:

I captured my ciliates on November 10th and found several ciliates in my soil sample. The ciliates I found were very small and very fast. There were several in many of my 5 uL samples and they were clear. Some of the ciliates ran in a straight direction across the microscope lens and some ran around in circles and zigzag formations. I found these ciliates at around 3:15 p.m. and completed several samples to culture them in different wells.

Conclusion:

This lab allowed me to see the different percent composition of my soil that I used where my ciliates were found. I discovered that the majority of my soil is made of silt, which is what resides in the middle of the other two layers. The least percent composition of material was clay, at 7%, which resided at the tope of my tube. For my ciliate capture, it was very interesting to see the different organisms and how many ciliates there were in my small 5 uL samples.My tube, petri dish and 24 well plate were all labeled with my ID DCG33F17 and were placed in my assigned drawer. I found many ciliates in my soil and am curious to see what I will discover next week after they have been cultured.

November 3

Lab 11: Soil Set-Up (11/2/17)

Print Friendly, PDF & Email

Lab 11: Soil Set-Up

Purpose: To determine the pH of the dry soil, create a non-flooded plate, observe soil characteristics and prepared to deal with ciliates for future lab experiments.

Introduction: Prior to this lab, the first lab we completed in this class was collecting soil and describing various aspects of where and when the soil was found, what the soil looked like and other various characteristics. Bringing the collected soil to class in a ziploc bag, we then massed the wet soil into a petri dish, wrote down the measurements and weight in grams, labeled the petri dish with the ID code DCG33F17, and placed it in our assigned drawers for later use. Today, after pulling out our now dry soil, the mass will then be able to be calculated and the concentration of water in the soil can also be found. Using this dry soil will be extremely useful in these next experiments, as we use this soil to create a non-flooded plate and discover more ciliates.

Materials:

  • Petri dish
  • Dry Soil
  • Scale
  • Pipette
  • Dissecting microscope
  • Centrifuge
  • Vortex
  • Test tubes
  • pH paper
  • Detergent

Procedure:

Percent Soil Water Content

  1. Retrieve your soil sample and calculate the mass of the water that has evaporated from the soil.
  2. Convert this to a percent. Use the equation (wet soil)-(dry soil)/ (wet soil) x 100
  3. Add the calculations to your QTM sheet.

Soil pH Protocol

  1. Place about 3 mL of soil in a labeled 10 mL tube and fill to the 8 mL mark with distilled water. Mix thoroughly for 3-5 minutes and allow the soil to settle to the bottom.
  2. From the top, take out 1 mL of liquid from the tube and transfer it to a microfuge tube.
  3. Spin the tube in the centrifuge for 1 minute to pellet the soil.
  4. To test the pH, place a small strip of the paper in a clear glass tube and add the clear soil water onto the strip.
  5. Compare the color of the pH paper to the pH sheet and record your pH in your notebook.

Determining Soil Texture

  1. Use soil that has minimal large chunks and other debris.
  2. Add soil to about the 4 mL mark in a tube.
  3. Add water and mix vigorously.
  4. Add 1 drop of dispersing agent and re-mix.
  5. Let the tube sit for 30 seconds, then watch how the mixture is separated.
  6. Use a ruler to measure the % sand, silt and clay and record your soil type in your notebook.

Non-Flooded Plate

  1. Transfer some soil into a different petri dish and add distilled water until the soil is goopy.
  2. Look at the petri dish under a dissecting microscope.
  3. Look at the characteristics of your soil and write them down.

Data & Observations:

Determining water content:

  1. Wet soil= 15.9 g
  2. Petri dish= 11.1 g
  3. Total weight of wet soil and petri dish=27.0 g
  4. Dry soil= 13.6 g
  5. Total weight of dry soil and petri dish=24.7 g

Equation: (wet soil)-(dry soil)/ (wet soil) x 100= 15.9-13.6/15.9 x 100= 14.5%

pH: After I added drops of the clear soil water onto the pH paper in the glass tube, I found that my pH matched to a darker green that has a pH of 7. Thus, my soil has a pH of 7, which is neutral.

Soil texture: The sand started falling very quickly and fell at the bottom, the clay stayed at the top and the silt resided in the middle.

Non-flooded plate: The soil looked goopy, but not too wet. After placing it under a dissecting scope, I was able to see the different sized soil particles. No ciliates were found moving yet and the soil particles has different colors, such as clear, light brown and dark brown.

One drop of detergent was added to the tube with soil and diluted with water. This tube with the segregated soil parts was set aside and put away for further use in the next lab.

Conclusion: 

The petri dish for the non-flooded plate was labeled with my ID name DCG33F17. This lab was designed to set up the non-flooded plate for the next lab, where we will then deal with ciliates in the soil. The soil used for the non-flooded plate had pieces that were various shapes, sizes and colors. This non-flooded plate will be used in the next lab for looking at ciliates, as well as the tube where the liquid is separated between clay (top), silt (middle) and sand (bottom). Using the calculations and information found in this lab, we will then be able to discover even more information with the soil collected at the beginning of the year. One possible source of error in this lab could have been the microfuge tube was centrifuged but not balanced, which could affect the pH found by adding this clear water onto the pH paper.

October 19

Lab 9: QTM and Figure of Experimental Groups (10/19/17)

Print Friendly, PDF & Email

Figure of Experimental Treatment vs. Control Data

Purpose:

To produce a clear and informative graph that conveys the message lying behind your data.

Procedure:

In making this figure, I first opened up my Excel file that contained my two columns of data for the control and the experiment. To end up with a concise and representable graph, I took the average of my control and treatment data first. I then selected both of the columns, went to the ‘Insert’ tab, selected ‘Recommended Charts’ and chose the graph that would best display my data. After I chose my chart, I was able to type in a specific title and my x and y axes by going to ‘Chart Design’, clicking ‘Add Chart Design’ and clicking ‘Axis Titles’. I put labeled my x-axis as ‘Experimental Groups’ and my y-axis as ‘Cells/mL of Tetrahymena’. I also incorporated the standard error in the graph to show that there was no difference between the means of the control and the treatment. I did this by, again, pushing the ‘Chart Design’ tab and ‘Add Chart Design’ and then choosing ‘Error Bars’ and standard errors. Lastly, I right-clicked on the graph and pushed ‘Format Data Point’, which allowed me to change the color and patterns of the different columns to differentiate them both.

Data & Observations:

This graph represents the average cells/mL of the control and the treatment groups of Tetrahymena. The control group, in this graph, is blue and it has small dots to distinguish it as well, while the treatment group is represented by green diagonal lines. The line above each column represents the standard error of each group, which allows one to be able to compare the graphs and determine whether there is a true difference between the data.

Conclusion:

In this lab, I went through the process of creating a figure to compare my treatment and control data. After editing and looking at several charts, I found that a bar graph, showcasing with the means of the control and experimental group, was the most concise figure to make. Incorporating the standard error in the graph also revealed that there was no real difference between the two groups. This is justified by the p-value, because the p-value is greater than 0.05, revealing that there was no real difference between the means, thus supporting the null hypothesis. This graph was clear, concise and correct, and would allow both the researchers and readers to easily understand the information on the cells/mL in the treatment versus the control. This figure will be essential to the research paper, because it will allow readers and researchers to understand and interpret the data collected in the lab experiment.

October 13

Data Analysis 10/12/17

Print Friendly, PDF & Email

Data Analysis: Group Experimental Treatment, Control and Initial Cell Count

During this lab period, we spent our time working on the data analysis for our experiment. I first started out by taking all of the information and numbers from my group (group 4) and separated them into two categories, one for the experimental treatment and one for the experimental control. Thus, there were 18 numbers for each group, totaling 36 numbers altogether for the data. Once I categorized the numbers of the cells counts per mL on my excel page, I did a data analysis for each group. This analysis was able to show me information such as the mean, median, mode, minimum/maximum range, standard deviation, confidence level and more. After finding this information, I created a bins category for each group, where I grouped numbers up evenly between the range of data in order to make a histogram. The goal of the histogram was that it ended up being a normal curve, meaning that the most data fell in the middle, near the mean, and gradually died off at the ends. Also, a normal curve has the median and mean relatively the same. As seen in the histogram of our group experimental treatment, the graph demonstrates a relatively normal curve. For the histogram on the group experimental control, the graph is skewed to the right, which means that the mean is much larger than the median. However, in this case, we will simply assume that the histogram followed a normal curve. After creating the histograms, I completed an F-Test. The F-test tests variance, or how far points fall from the mean. Depending on if there is variance shown with this test, you will use a specific T-test that is either equal or unequal variance. After the F-test, I made a T-test, which is used to find the differences between means. There are four assumptions for a T-test. Observations are independent, there are continuous distributions (counts), there is a normal distribution (assumed) and variance (tested by F-test). My F-test revealed that there is not enough evidence to reject the null, which means that we will stick with the null hypothesis, stating that there is no difference in cell count between our four treatments. This means that we will use a T-test: Two-Sample Assuming Equal Variances. Once the T-test was completed, I found that we would not reject the null, so the means are equal. Some errors could have occurred with this data due to differences in people counting their cells/mL of solution. Some results for the cell counts were very different than the rest, which could clearly have an effect on the results.


Statistical Data:

Group Experimental Treatment Group Treatment Bin Frequency
223330 Treatment Bins 100000 4
194670 Mean 210629.6111 100000 150000 0
251670 Standard Error 23615.59614 150000 200000 4
72000 Median 213665 200000 300000 7
186333 Mode 72000 300000 350000 2
301000 Standard Deviation 100192.4891 350000 400000 0
191333 Sample Variance 10038534862 400000 450000 1
317333 Kurtosis -0.355373874 450000 More 0
292667 Skewness -0.289243951
204000 Range 367000
249000 Minimum 34000
193000 Maximum 401000
34000 Sum 3791333
72000 Count 18
55000 Confidence Level(95.0%) 49824.55263
257667
295330
401000
Group Experimental Control Column1 Control Bins Bin Frequency
180000 150000 150000 5
211670 Mean 188869.9444 200000 200000 8
189000 Standard Error 17924.50792 250000 250000 3
163000 Median 171500 300000 300000 0
131000 Mode #N/A 350000 350000 1
173000 Standard Deviation 76047.2466 400000 400000 0
146660 Sample Variance 5783183715 450000 450000 1
114000 Kurtosis 6.265396522 More 0
158330 Skewness 2.265813764
132333 Range 324000
111000 Minimum 111000
163666 Maximum 435000
197000 Sum 3399659
203667 Count 18
170000 Confidence Level(95.0%) 37817.40604
435000
304000
216333
F-Test Two-Sample for Variances T-Test for Equal Varianaces
t-Test: Two-Sample Assuming Equal Variances
Variable 1 Variable 2
Mean 210629.6111 188869.9444 Variable 1 Variable 2
Variance 10038534862 5783183715 Mean 188869.9444 210629.6111
Observations 18 18 Variance 5783183715 10038534862
df 17 17 Observations 18 18
F 1.735814623 Pooled Variance 7910859289
P(F<=f) one-tail 0.132760337 Hypothesized Mean Difference 0
F Critical one-tail 2.271892889 df 34
 We will stay with the null hypothesis and say that they are equal. t Stat -0.733941868
P(T<=t) one-tail 0.23400777
t Critical one-tail 1.690924255
Group Initial Cell Counts Initial Cell Count Bins P(T<=t) two-tail 0.468015539
42500 Column1 50000 t Critical two-tail 2.032244509
28000 100000 We would not reject the null ,so the means are equal.
31000 Mean 75625 150000
52000 Standard Error 36450.8659 200000
43250 Median 42875 250000
257000 Mode #N/A 300000
Standard Deviation 89286.02214
Sample Variance 7971993750
Kurtosis 5.799069899 Bins Frequency
Skewness 2.39663668 50000 4
Range 229000 100000 1
Minimum 28000 150000 0
Maximum 257000 200000 0
Sum 453750 250000 0
Count 6 300000 1
Confidence Level(95.0%) 93699.93378 More 0
October 5

Lab #7: Toxicity Assay of BPA (10/5/17)

Print Friendly, PDF & Email

Lab 7: Toxicity Assay of BPA

Purpose: The purpose of part one of this lab is to make an assay of BPA using an experimental design and to determine the effects on the Tetrahymena when different concentrations of BPA are added to the stock, which will be completed by serial dilutions.

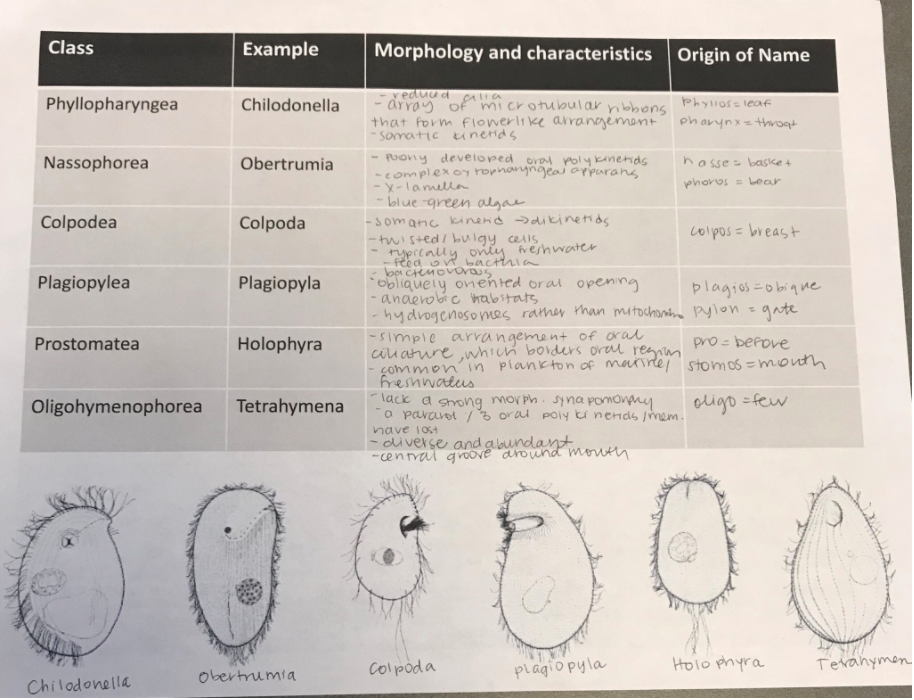
Introduction: This is the first part of the large research lab that we will be completing this semester on how UV blockers, in this case BPA, will effect Tetrahymena. Overall, we also want to look at the environment and how it will be effected by this particular UV blocker as well. If the Tetrahymena die with more BPA added to it, then that means BPA could have a negative effect on the environment, particularly with sunscreen. In this experiment, the dependent variable will be the ciliate count, the independent variable will be the UV filter, BPA, and the control will be the media that the ciliates are in. There will be three replicates per treatment, which will then be averaged; from there, we can then find the number of cells/mL in a solution by also multiplying by the dilution factor from the well that we decided to count. An assay is how you set up a design, so in this case, we will do a 1:10 dilution of 2 M BP-3. The treatment will be the UV screen BPA, as mentioned previously. BPA is 2-hydroxy-4methoxybenzophenone, with a molecular weight of 228.25 grams, where BP-3 is also known as benzophenone-3.

Materials:

  • Distilled water
  • Test tubes
  • Wells
  • Dissecting microscope
  • 1 x 10^3 cells/mL solution
  • Tetrahymena stock
  • BP-3 (benzophenone-3)
  • Glass slides
  • Large pipettes
  • Pipette covers
  • Iodine

Procedure:

Culture and Media Preparation:

  1. The Tetrahymena culture is set up and ready to be used for the experiment.
  2. Each group will have an aliquot of the stock culture and a tube of sterile proteose-peptone-tryptone (PTP) media and a tube of distilled water.

Serial dilutions of the stock culture:

  1. Use the p1000 to pipette 450 uL of PPT into 3 wells.
  2. Use the p200 to pipette 50 uL of a well-mixed stock culture into the 450 uL of PPT media in well 1.
  3. Mix by gently shaking the plate.
  4. Change tips and transfer 50 uL of 1:10 dilution into the 1:1000 well.
  5. Mix gently by shaking the plate.
    • Well 1: 1:10 –> 450 uL of media (PPT) and 50 uL of stock culture.
    • Well 2: 1:100 –> 450 uL of PPT media and 50 uL of 1:10 dilution.
    • Well 3: 1:1000 –> 450 uL of PPT media and 50 uL of 1:100 dilution.

Baseline stock culture cell counts:

  1. Add 10 uL of iodine to each well and gently shake. Then, count the ciliates on the dissecting scope.
  2. Use the dissecting microscopes to observe the Tetrahymena in each well.
  3. Choose the dilution that will allow you to count between 10-30 cells in a 10 uL drop.
  4. Observe the 10 uL drop under the dissecting scope using a clean slide.
  5. Count at least three 10 uL drops from the optimum dilution and calculate the average number of cells/mL in the stock culture. Record your work in your notebook and on the Google Sheet.

Calculation: # of cells/10 uL x dilution factor x 1000 uL/mL= cells/mL

Data & Observations:

Experimental set-up

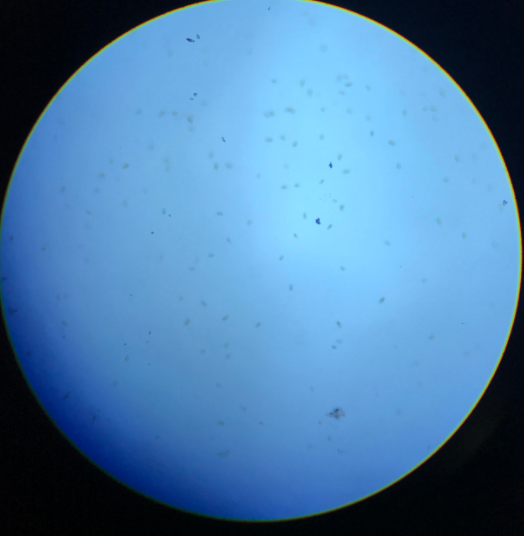
In the first column of wells, we have A1, B1 and C1. A1 has a 1:10 dilution, B1 has a 1:100 dilution, and C1 has a 1:1000 dilution. I took 4 samples of 10 uL of A1 and counted 46, 21, 78 and 25 cells in each of the replications. The average cell count per 10 uL was 42.5 cells/10 uL, which means that it would be 4.25 cells/uL. We then multiply this number by 10 because the dilution factor is 10, thus ending up with 42.5 cells/uL. Finally, we multiply this number by 1000 uL/mL in order to end up with 42,500 cells/mL.

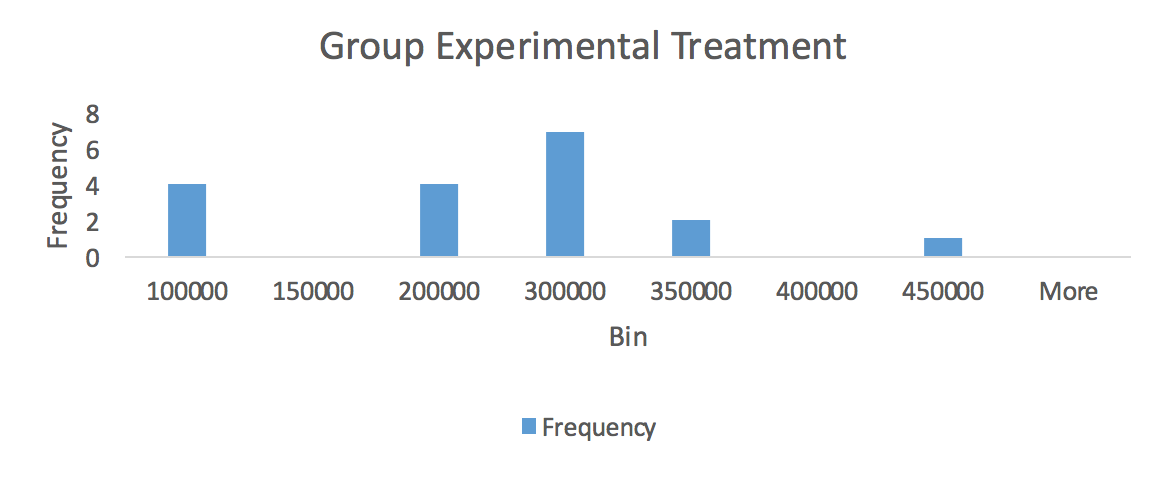
The average cell count for the class was 59,045.65 cells/mL, with a standard deviation of 28,317.76. In order to find how much stock per mL we need to get the final volume, we must use C1V1=C2V2. C1 is 59,045.65, V1 serves as ‘x’, C2=1000 and V2=20 uL. The final result is 0.338725 mL, which gets multiplied by 1000 uL/mL to get 338 uL. We put 338 uL of Tetrahymena in an empty container, then fill it up to 20 mL with PPT to dilute it. Each person will make an additional 6 wells, 3 with the treatment and 3 with the control, which is distilled water. Thus, each well will end up with 1 mL.

My group was assigned Treatment 4, which was 1000 ug/mL. The stock BP-3=10 mg/mL, so we must complete C1V1=C2V2 again to find the volume needed for the stock.

(1000 ug/mL)(1 mL/1000 ug)= 1 mg/mL –> (10 mg/mL)x = (1 mg/mL)(1mL), so x= 0.1 mL, or 100 uL.

These calculations show that, for our treatment, 100 uL will be the treatment, so 900 uL stock (cells) will be used to get 1000 uL of solution, which is 1 mL altogether. Thus, for column two, wells A2, B2 and C2 all contain 100 uL of the treatment and 900 uL of the stock, which is 1 x 10^3 cells/mL. In column three, wells A3, B3, and C3 all contain 100 uL of the control, which is distilled water, and 900 uL of the stock. The following day, 20 uL of iodine will be added to each of the six wells, then 10 uL drops (with three replications each) will be recorded in cells/mL.

Conclusion:

This lab allowed us to use a UV filter/blocker, BPA, to determine the effects of Tetrahymena in a stock solution and to determine what potential results could happen to the overall environment. The start time of the experiment was 2 pm (1400) and throughout the week we will check to see the results between the four different treatments and how the Tetrahymena are affected. A comparison of the treatments is crucial, because each treatment has a different concentration of BPA, which means that there should be a pattern to the amount of cells that are the solutions, depending on the particular treatment. Because our group had treatment 4, with 100 uL of treatment, we should have the least number of cells in our 10 uL observations and overall solution because we had the most treatment. On the other hand, the group that only had 25 uL of treatment should have many more ciliates in their solutions and could potentially need a serial dilution to count the cells. This lab served as the first step into the research paper that we will be writing on this entire experiment, which will continue on next week. Some potential sources of error during this lab include not shaking or mixing the solution before taking a sample and not collecting a sample from the top of the solution.

September 29

Lab #6: Serial Dilutions and Using NaCl (9/28/17)

Print Friendly, PDF & Email

Lab#6: Serial Dilutions and Using NaCl

Purpose: To continue using serial dilutions to find the number of ciliates in an undiluted solution while experimenting with NaCl serial dilutions to prepare for the experiment working with UV filters and sunscreen.

Introduction: In this lab, we are going to continue working with serial dilutions to prepare for the real experiment with UV filters and how that will affect the Tetrahymena. Thus, again, we will measure the concentration of a dense culture by using these serial dilutions in order to count a large number of cells. It is crucial to understand this process and the calculations for finding the number of cells/mL because we will have to make up our own dilution factors and solutions on the next experiment.

Materials:

  • Pipettes
  • Glass slides
  • Compound microscope
  • Distilled water
  • Tetrahymena solution
  • NaCl
  • Notebook

Procedure:

  1. Using the Tetrahymena culture and the media, make a 1:10 dilution series to a 1:1000 dilution in labeled microfuge tubes.
  2. Once the three dilutions are made, take 5 microliters of each solution and place them on the glass plate. Also include the culture without any dilution to compare.
  3. Count the number of ciliates in each of the drops of solution and collect the data. Once you completed counting, choose one of the dilutions to repeat again.
  4. Repeat the desired dilution about 9 times (three times per person) and average the number of cell counts per 5 microliters.
  5. Complete the remaining calculations to find the average cells/mL in undiluted solution.
  6. For Part 2 of the lab, complete serial dilutions with NaCl solution to determine which amount of NaCl shows the minimum effect on the ciliates moving around.
  7. First, take 90 uL of NaCl and mix it with 10 uL of distilled water. This will be the first dilution.
  8. Once properly mixed, take 5 uL of Tetrahymena stock and place it on a glass slide.
  9. Next, place 5 uL of NaCl diluted solution onto the ciliates and record what happens.
  10. Complete this experiment several times with different NaCl solutions diluted to find which of the solutions allows for the smallest effect on the ciliates.

Data & Observations:

Part One:

Dilution Average cell counts/5 uL Average cells/uL in drop Average cells/uL in undiluted sample Average cells/mL undiluted
0 TMTC TMTC TMTC TMTC TMTC
10-1 15,15,12,20,16,10,22,11,17 15.33 3.07 30.70 30,700
10-2 0 0 0 0 0
10-3 0 0 0 0 0

Here we had an average of 15.33 cells/5uL, which we then divided by 5 to get 3.07 cells/uL. Because this was a 10^(-1) dilution, we multiplied by 10 to get 30.70 cells/uL in the undiluted solution. Lastly, we multiplied 30.70 cells/uL by 1000 uL/mL to get 30,700 cells/mL.

Part Two:

NaCl Dilution Tetrahymena Stock amount in uL NaCl Concentration in %
undiluted 5 100
10-1 5 90
10-5 5 50
10-9 5 10

Observations with each solution:

  1. No dilution: The ciliates slowed down very quickly, within a matter of seconds, and they died shortly after.
  2. 10^(-1): The ciliates in this dilution took a little longer to die, but it was still a very quick process and it took under 20 seconds for all of the organisms to die.
  3. 10^(-5): With 50% NaCl this time, this process was slower, yet still quick. The ciliates raced to the edges of the solution and spun around in circles until they died. It took about double the time for them to die compared to the first two experiments.
  4. 10^(-9): In our last experiment, we found that there was little to no effect on the ciliates when adding only 10% of NaCl to the stock. We even checked how they were doing after five minutes and they were still running around in the solution normally. This is how we were able to tell that this solution was our minimum amount of NaCl that allowed for there to be the smallest effect on the ciliates.

NaCl mM calculations:

(0.001)(5)=x(10)

x= 5 x 10^(-4) mM

Conclusion:

We decided to replicate the 10^(-1) dilution because there were a good amount of ciliates moving around in the solution. Completing several experiments is very important in labs, because it is able to decrease the variability and obtain smaller standard deviations. The goal is to get a small standard deviation and to have numbers as close to the mean as possible. Thus, by looking at different samples of the Tetrahymena stock, we can compare our findings and average the number out to find the best possible answer for the results. I think another thing that is very important for having good results and minimizing variability is using the same pipettes. The large pipettes each have ranges for the amount of microliters they can transfer and the smaller the range, the more specific the amount of solution is transfer. Thus, we used the same pipettes each time and used the smallest pipette when possible to prevent further errors. We also had potential errors when we counted the fast ciliates moving around, so that is another reason to have more trials. For the second part of the lab, we had control over how we were going to use the NaCl to find the minimum amount of the solution for there to be a slight to no effect on the ciliates. For the NaCl our group plan was to keep the Tetrahymena stock constant at 5 uL while completing a serial dilution on the NaCl to lower its effects on the ciliates. We first started by placing 5 uL of undiluted NaCl onto 5 uL of the stock. We found that, almost immediately, the ciliates died in less than 15 seconds. We then lowered the NaCl concentration by doing a 1:10 dilution and placing 10 uL of distilled water combined with 90 uL of NaCl. The results showed that, after placing this solution onto the stock, the ciliates quickly slowed down and died again in about 18 seconds. We concluded that the NaCl was very strong, so we made a solution with 50% NaCl and 50% distilled water. This time, it took longer for the ciliates to slow down and die (about one minute). There was obviously a trend that the less the NaCl there was, the longer it took for the ciliates because the effect was not as strong and immediate. Lastly, because we wanted to find the minimal effect on the ciliates with NaCl, we made a solution with only 10% NaCl and 90% of distilled water. We placed this solution onto the Tetrahymena stock and the ciliates looked normal. They swam the same and their characteristics looked almost the same as how they moved and interacted when there was no NaCl in the solution. This result allowed us to conclude that, for our experiment, the NaCl that showed the minimal effect on the ciliates was with 10% of NaCl and 90% of water. We then found the mM of the NaCl and got 5.0 x 10^(-4) mM. This lab was very beneficial to reinforce what we need to understand for the lab next week that deals with the UV filters.

September 21

Lab 5: Making a Serial Dilution and Developing an Experiment (9/21/17)

Print Friendly, PDF & Email

Lab 5: Making a Dilution Series and Developing an Experiment

Purpose: Develop a question for the experiment and learn how to count ciliates per mL in a solution by using a serial dilution.

Introduction:

In this lab, we will learn how to measure the concentration of a dense culture. Serial dilutions are a series of dilutions and they are extremely helpful when you want to find the number of ciliates in an undiluted solution. If you attempt to count a large number of cells in an undiluted solution, it would take a very long time. Thus, you may need to perform a serial dilution. An example of how to do that is demonstrated. The problem is looking for the concentration per mL if 2 uL of a 1:100 dilution of a culture has 50 cells. The number of cells/uL in a dilution tube would be 50 cells/2 uL= 25 cells/uL. The cells/uL in an undiluted stock tube would be 25 cells/uL * 100 (dilution factor)= 2500 cells/uL undiluted. Lastly, the cells/mL in an undiluted culture would be 2500 cells/uL * 1000 uL/mL= 2,500,000 cells/mL undiluted.

The other part the lab today was developing an experiment with the use of Tetrahymena. Our group looked at different situations that could affect the Tetrahymena and came up with one.

Materials:

  • Computer
  • Lab notebook
  • Media/solution with cells
  • Large pipette
  • Wells
  • Compound Microscope
  • Glass slides

Procedure:

  • Using the media/Tetrahymena culture, make a 1:10 dilution series to a 1:10,000 dilution labeled ufuge tubes.
  • 1:10 dilution= 10uL of TH into 90 uL of media.
  • Mix and place a 5 uL drop of each dilution on a plastic plate or concavity slide and count the number of cells. If there are too many to count, use the abbreviation TMTC.
  • Find the dilution that has an easily countable number of cells (10-20) and repeat measurement 3 times.
  • Calculate cells per mL in each tube.
  • Average the number of cells per 5 mL x (dilution factor) x (1000 uL/mL)= cells/mL.
  • Fill out the chart on the QTM worksheet and use the previous calculations to help you if needed.
  • After finished with the microscope, turn it off and make sure that it is correctly put away.
  • Compare your results with the different titrations.
  • For the experimental findings, discuss with your group what some potential experiments could be, write them down on the excel spread sheet given by the teacher, fill out the rest of the information about your idea, and brainstorm some details about what could be done to make the experiment work.

Data & Observations:

Dilution Average cell counts/5 uL Average cells/uL in drop Average cells/uL in undiluted sample Average cells/mL undiluted
0 TMTC TMTC TMTC TMTC TMTC
10^(-1) 58 58 11.6 116 116,000
10^(-2) 3, 2, 4 3 0.6 60 60,000
10^(-3) 0 0 0 0 0
10^(-4) 0 0 0 0 0

This data shows that the average number of cells/mL in the undiluted solution should be somewhere between 60,000 and 116,000 cells/mL.

The way we calculated this data was by looking at our previous calculations. For example, for the dilution 10^(-2), we took the average of the three solutions with this dilution and got 3 cells/5uL. We then divided 3 by 5 to get 0.6 cells/uL. Then, because the specific dilution here was 10^(-2), we had a dilution factor of 100, which we multiplied by 0.6 cells/uL and got 60 cells/uL undiluted. Finally, we multiplied this number by 1000 since we wanted mL and there are 1000 uL in 1 mL, which allowed us to get the ending result of 60,000 cells/mL undiluted.

Conclusion:

For the experimental thinking prior to the serial dilutions lab, we came up with making our own serial dilutions and diluting strong acids and bases, such as HCl and NaOH, to determine the survival effects of the ciliates in the media. These materials will be easily accessible and under $20, though we want to be very careful when dealing with the solutions by putting on gloves if needed. It should be very interesting to see what happens to the ciliates when different drops of different concentrations are added. I predict that the more diluted the solution, the greater survival rate there will be for the ciliates.

For the serial dilutions lab, I really enjoyed testing out the different pipettes and understanding how to use them properly. I think that the ending results of the average cells/mL undiluted were very different due to different sources of error. For one, I think that we did not have enough ciliates in our 10^(-2) dilution to count affectively and get great ending results because we only found 2, 3, and 4 cells in that solution. I also think that we could have been off on counting 58 ciliates in the first dilution because they were all running around and it was difficult to get an exact number. Overall, this lab was very helpful in allowing me to understand how to create a serial dilution and how effective it really is. It would be incredibly difficult to count all the cells in an undiluted solution without creating a serial dilution. I learned a lot from this lab and am excited to use this new information to use it in further research with ciliates and, specifically, Tetrahymena.

September 14

Lab #4 and Primary Article 9/14/17

Print Friendly, PDF & Email

Lab #4: Observing Tetrahymena

Purpose: The purpose of this lab was to get a feel for Tetrahymena and to view some of their characteristics and details.

Introduction: This is basically an introduction into the discussion of Tetrahymena so that we can further extend our knowledge on these organisms and view them. It is also important to know information about Tetrahymena prior to the lab. Tetrahymena are free-living ciliates that are great model organisms, since they are very easy to grow and you are able to get many of them in one small test tube. They also have four membranes and are important when discussing telomeres, cell cycles and the cytoskeleton. They have several interactions with the environment, which is important to take note of.

Materials:

  • Methylcellulose
  • Tetrahymena
  • Glass plates
  • Coverslip
  • Pipettes
  • Compound microscope
  • Notebook
  • Lens paper

Procedure:

  • First, transfer a drop of Tetrahymena stock culture to a clean concavity slide and cover it with a clean coverslip.
  • Observe Tetrahymena on the compound scope using 4x, 10x, and 40x objectives.
  • Record your procedure and observations in your lab notebook.
  • Make a new slide and add a drop of methylcellulose before adding the coverslip.
  • Record your procedure and observations in your lab notebook.

Data & Observations:

  • 4x lens: There were several Tetrahymena running around on the screen and they were very small. They were round and had a slight oval shape to them. The insides were not clearly shown with this magnification.

  • 10x lens: The Tetrahymena here were more clearly depicted now and I was able to see green coloring on the inside of the organisms. There were evidently different organelles seen and I could see their details pretty well.

  • 40x: In this lens, I was still able to see multiple Tetrahymena. The one organism that I focused on was moving slightly slower than the rest of the organisms that were running quickly across the screen. The organism I saw was moving slowly in a circle around itself, contrary to the linear paths of some other Tetrahymena. The details I was able to see with this magnification were incredible! I saw the shapes of the different structures inside these small creatures and the characteristics of them were easily distinguishable.

Conclusion: This microscope lab was quite short, but it was still really fascinating and it was a great way to get a first look on Tetrahymena. It caught my interest after I was able to depict the organisms in the microscope and learn more about them and their traits rather than simple background information. In this lab, I cleaned my lenses and turned on the microscope. I then placed a drop of the solution with Tetrahymena and put a coverslip on it. I went through the 4x, 10x and 100x lenses and saw how the different magnifications revealed the organisms. I then added methylcellulose to the edges of the coverslip to slow down the organisms so that I could get a closer and better look at them and take a picture of them up close. Overall, this lab sparked my interest in Tetrahymena while allowing me to further learn and interact with the compound microscopes. I am eager to learn more about these creatures and how we can further experiment with them in different environments.

Reading the Primary Literature

1. What is the central question? What was the primary finding?

  • Central question: What are the different effects of Tetrahymena IFT172 domains on anterograde and retrograde intraflagellar transport?
  • The primary finding was that there were several studies on mutants of IFT (intraflagellar transport particles) that revealed a defect in anterograde and retrograde IFT. The results revealed that there was complete failure in the assembly of cilia or short cilia, while an issue in retrograde IFT usually results in accumulation of IFT particles and       ciliary proteins at the ciliary tips. Thus, we must look at the different regions of ITF and each distinctive role that they play to determine the causes.

2. Background information

  • Tetrahymena serve as wonderful models to dissect the structural and functional relationship of ciliary proteins. In this article, they report the different characteristics of Tetrahymena IFT172 as well as its cloning.
  • Cilia and flagella are microtubule-containing organelles that protrude from the cell surface. They also have continual beating motility and are able to serve as sensors.
  • IFT is essential to build cilia and to regulate the length of the cilia.
  • Anterograde IFT moves the complexes from the cell body to the ciliary tip where the axoneme assembly occurs.
  • The IFT complex is altered at the tip region and it then interacts with the ciliary tip proteins, eventually activating a new motor protein (dynein) for retrograde transport back to the cell body.
  • If there is a defect or malfunction in anterograde IFT, then cilia will not be able to be assembled, even though malfunctions often cause IFT particles and ciliary proteins to accumulate.
  • Ciliated protozoa and Tetrahymena thermophila have elaborate microtubule systems, which include hundreds of cilia and basal bodies.

3. What was the design of the experiment? Choose a figure and describe the data and results.

  • There were several designs of the experiment to reach a result, including Tetrahymena stains, culture growth, conjugation, gene cloning and sequence analysis, measuring swimming patterns, and immunofluorescent staining.
  • In figure D, it showed negative images of the swimming paths of the cells that were rescued with four different truncation constructs. These paths were observed and recorded under a low magnification along with a dark-field microscope. There were four different observations seen with the IFT172 having different lengths. This proves that IFT172 clearly is associated with the production of cilia and movement, because the organisms are moving differently depending on the size of the IFT172. There was clearly a loss of normal motility and the ability to complete cytokinesis, because the cells could not swim and settled to the bottom, as shown in the pictures. This indicated that there were no cilia or that the cilia were not functional.


4. What questions do you have?

  • How were Tetrahymena strains created without being expressing IFT172?
  • How was the Tetrahymena IFT172 gene sequence identified?
  • How was the structure of IFT172 amplified using RT-PCR?
  • When the coding region of the cDNA was compared to the genomic DNA sequence, what exactly were they looking for to understand the issue with the cilia?
  • How exactly does the IFT172 relate to anterograde and retrograde IFT and what do the experiments with IFT172 show about anterograde and retrograde IFT?

5. (a) Prepare a list of relevant questions, (b) Do you agree with the interpretation of the results?, (c) What information will you look for in your next search?

(a)

  • How am I able to take this information and these results and conclusion and transfer it to something I could do in a lab with Tetrahymena?
  • Why did they complete so many different experiments when they could have focused on one or a few experiments and got more detailed information from using Tetrahymena?
  • How is this information and data relevant to today’s world?
  • If Tetrahymena was not used in this experiment, how would the methods and results change?

(b) I definitely agree with the interpretation of the results. The explanation of the reasoning of a certain action was explained, and after every experiment, it was discussed what happened and why it happened. The evidence matched the reasoning and it was, therefore, much more credible and reliable. There was a significant amount of data used to provide evidence for the malfunction of cilia in IFT172 and results cleared up the confusion and provided significant and understandable observations that matched with the interpretations of what went on during the different experiments. The only think I would suggest is that they are further able to evaluate the results and apply them to the world today. It would be stronger if they could compare the affects of organisms today, which would allow the readers to more easily comprehend the effects of the experiment and its importance to us.

(c) I will make sure to look for both quantitative and qualitative data. I think it is crucial that there is different evidence and different interpretations so that the experiment is more reliable, so by provided different data and observations, I will be able to more clearly understand the results and how they are important. I also want to look for how ciliates are associated in each of the articles. Tetrahymena is the ciliate we have been discussing, so for the next primary article that I find, I will make sure to include this organism in my search to see how they play a role and think about what experiments I will be able to do with them in the lab.

Below is an attached pdf of my primary article.

Tetrahymena Primary Article-2cok0vx