October
19
Lab experiment #9 (10/19/17)

Purpose: The purpose of this experiment was to learn how to make a graph with our data from lab 7 on excel.
Procedure:
- To make a bar chart you first open excel and add your data onto the program. Then, you select all of your data and click “insert” and “recommended charts.” Once you clicked “recommended charts” click on the bar chart.
- To include the starting cell concentration, add a text box to write your starting cell concentration.
- To add axis labels and a title, first click the chart. Then, click “chart design,” “add chart element.” Then, to add the axis click “axis titles” and you can choose to add a horizontal or vertical axis. To add the title click “chart title.”
- To change the color of the graph, first click the chart. Then, click “chart design,” “change color.” Then, pick a color for your graph.
- To add standard error bars, first click the chart. Then, click “chart design,” “add chart element.” After that, click “error bars,” “more error bars,” “custom,” “specify value.” After that, select both of your standard errors and add them into the positive and negative error value section.
- To convert everything to log10, first click on an empty space on the excel home page. Then, write “=log10” into the empty space. After that, select your standard errors, and you will get your conversion.
- To add an asterisk, create a text box onto your graph. In the text box write a “*” and the p value from your t test.
- To save as a picture/jpg, right click your chart in excel and then click “save as picture.” From there, title your chart and save it as a JPEG.
- To insert your chart into a word document, copy it from excel and paste it into a blank word document.
- To add a caption in word, “click chart,” “references,” “insert caption.”
Data:
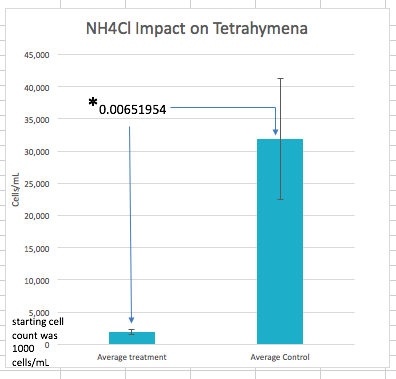
Figure from Excel
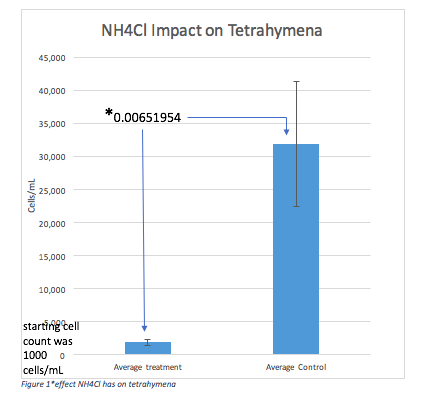
Figure from Word
Conclusion: Overall, using excel in class had helped me become more comfortable with making a graph and the calculations of my data.