November 30

Lab 13–Ciliate discovery, photography, and presentation–16 November 2017

Print Friendly, PDF & Email

Purpose:

The purpose of this experiment was to take pictures of any ciliates found in order to identify the morphology of these ciliates.  We also continued practicing with microscopes and gathering data.  We also used the data recorded so far to begin to plan for the final presentation.

Procedure:

(If ciliates are found)

  1. Isolate ciliats in a well plate.  Observe the well plate under a dissecting microscope.
  2. Draw 5 microliters of ciliates with a micro pipette and place on a concavity slide.
  3. Slow the ciliate down with 5 micro liters of methyl cellulose, and observe the concavity slide using a compound microscope.
  4. Record the ciliate via photo or video.
  5. Start forming your ideas for your group presentation.
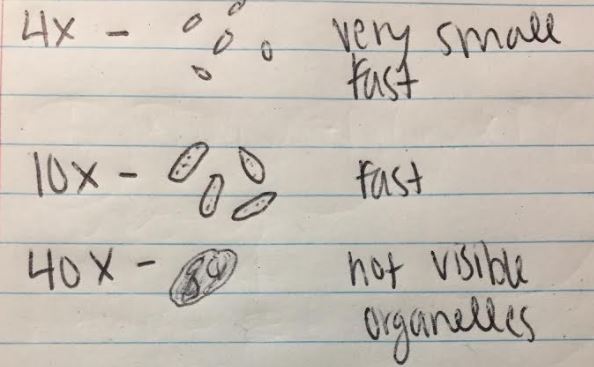
Data:

(No ciliates were observed).

Presentation will be created via Google Slides.

Conclusion:

Although there were no ciliates found, I was able to look at a lab partner’s ciliate under the compound microscope.  We also created an outline for our presentation.

November 30

Lab 12–Isolation and Observation of Ciliates from Soil Samples–9 November 2017

Print Friendly, PDF & Email

Purpose:

The purpose of this experiment was to use a Falcon tube to classify our soil.  We also observed our soil samples in attempt to locate live ciliates, isolate them, and extract them.  This lab allowed us to gain more information on our soil that will be necessary for future use.

Procedure:

  1. Measure cm of sand, clay, and silt in the Falcon tube.
  2.  Apply measurements on soil identification chart to determine clay type.
  3. Observe soil sample under dissecting microscope, and attempt to locate ciliates.
  4. If any ciliates are located, draw up individual ciliates using a micro pipette.
  5. Place ciliate extraction in a well containing 750 microliters of protozoa pellet.
  6. Isolate one ciliate if applicable and place it on a concavity slide.  Record your ciliate  with pictures.

Data:

Soil Type Clay
Soil Color Dark Brown
% Water 19%
pH 7
% Sand 43%
% Silt 52%
% Clay 5%
Clear Separation Yes

I was not able to identify any ciliates in my soil sample.

Conclusion:

Although I was not able to identify and isolate any ciliates, I was able to identify my soil type.

November 29

Lab 11–Non-Flooded Plate Experiment and Ciliate Isolation–2 November 2017

Print Friendly, PDF & Email

Purpose:

The purpose of this experiment was to observe and record the ciliates in our soil sample.  If this was successful, we would then isolate and culture a single ciliate from our sample. We did this by creating a non-flooded plate which we observed a week later.

Procedure:

  1. Weigh dry soil sample.
  2. Subtract sample weight from the weight of the petri dish.
  3. Calculate % water using formula %=((mass of wet soil-mass of dry soil)/mass of wet soil)x100
  4. Measure 3mL of soil and place it in a falcon tube.
  5. Add 5mL of DI water to falcon tube.
  6. Centrifuge the falcon tube and label it.
  7. Take 1mL of falcon tube mixture and place it in a small capsule.
  8. Centrifuge the capsule for a minute.
  9. Obtain a small glass container and put a small pH paper at the bottom of it.
  10. Using a pipette, draw up the liquid at the top of the capsule and place it in the glass container.
  11. Allow for the pH paper to change color.
  12. Obtain pH level by comparing the color to the pH chart and record pH value.
  13. Add a drop of texture dispersing solution into the falcon tube and shake it.
  14. After shaking, store the falcon tube in a tube rack.
  15. Add DI water to the petri dish ensuring that there is enough water to saturate the dirt sample without flooding the sample.
  16. Tilt the petri dish so that all water is collected at one end, and observe the water under a dissecting microscope.
  17. Store petri dish and come in sometime after 24 hours (we came one week later).
  18. Observe the sample under the dissecting microscope and record any ciliates present.
  19. If any ciliates are present, locate one and isolate it by extracting it with a pipette and placing into a well plate.
  20. Fill the well plate with 750 microliters of protozoa pellet.

Data/Observations:

Mass of dry soil:

percent water:

pH level: 7

There were no ciliates present in my soil sample initially or after waiting a week to observe them.


Conclusion:

This lab introduced us to creating a food plate and using that for experiments.  Although there were no ciliates found, I was still able to record the pH level, percent water, and percent clay and sand.

November 29

Lab 10–Computer Lab and Scientific Paper Rough Draft–10/27/17

Print Friendly, PDF & Email

Purpose:

The purpose of this lab was to share and compare the data of other groups.  This ability to compare others data to our own enabled us to better analyze and present our own data.  The end goal of this lab was to complete a rough draft of our final lab report and submit it.

Procedure:

  1. Each group presented their specific graph to the class.  Each graph was critiqued and after presenting we went back and fixed it.
  2. After all of the presentations were completed, each group worked on their lab report rough.  Some of the work done was converting and adding data from other groups, discussing the classes data in the discussion, and making other specific changes.
  3. The rough draft was then submitted to Canvas.

Data/Observations:

Conclusions:

This lab gave us further practice with Excel, and gave me more detailed knowledge on how to best represent data through a graph.  The purpose of this lab was to fix our graph and our rough draft.

October 19

Lab 9-Questions That Matter and Graph-19 October 2017

Print Friendly, PDF & Email

Purpose:

In this lab, we worked on creating a results graph that will be presented in class next week.  We went over what makes a good graph, and we also discussed what was expected of our rough draft due next week.  This lab furthered our practice of making graphs, and it taught us how to use and manipulate our data to make the graphs that would demonstrate our results data.

Procedure:

  • First use your data from data analysis to create a new chart with the means of the C-24 and TRMT-24.  Hi-light your data and create a chart that will best fit your data.  The mean for C-24 was 37417.8 and the mean for TRMT-24 was 23051.
  • Next, to title your x and y axis click on your graph go to chart elements and click axis title.  Name your x-axis Types of Treatment and your y-axis Cells/Ml.
  • Make sure you that you give your graph a descriptive title such as Average Effects of NH4Cl on Tetrahymena.
  • Next, create an error bar by clicking on your graph and going to add chart element.  Then, go to error bars and select more error bar options.  On the right of the screen select custom error at the bottom of the column.  In both the positive and negative slots, insert both standard error values that you got from your descriptive analysis.
  • Next, select the bars and select a color that will ensure that the columns are distinct.  Make sure that viewers are easily able to see the error bar.
  • Once your graph is made, you may change your graph design in order to make it the most descriptive for your data.
  • Once you are finished with your chart, save it as a JPEG.

Results:

The graph above demonstrates that the average cells/ml of the control group of Tetrahymena with 175mM of H2O was significantly larger than the average cells/ml for the treatment group with 175mM of NH4Cl on Tetrahymena.  This evidence supports that 175mM of NH4Cl has a detrimental effect on Tetrahymena.

Conclusion:

This lab enabled us to become more familiar with our data, and it gave us more experience with drafting a results chart.  This draft chart is something that will be presented to the class next week and used in our final paper.  This activity provided practice with analyzing statistical data and coming up with conclusions.

October 19

Lab 7-NH4Cl Toxicity Experiment on Tetrahymena-5 October 2017

Print Friendly, PDF & Email

Purpose:

The purpose of this experiment is to work with our groups to determine how different concentrations of NH4Cl affect tetrahymena.  This experiment will provide us with data that we will use in later experiments for a lab report and essay.

Procedure:

Culture and Media Preparation:

  • Each group has stock culture, a tube of PPT media, and a tube of sterile water.

Serial Dilutions of the Stock Culture:

  • Place 450ul of PPT into 3 wells.
  • Place 50ul of mixed stock culture into the 450ul of PPT media in well 1 (1:10).  Gently mix.
  • Transfer 50ul of well 1 into well 2 (1:100).  Make sure to change pipette tips before transferring.
  • Transfer 50ul of well 2 into well 3 (1:1000).

Baseline Stock Culture Cell Counts:

  • Use the dissection microscope to observe Tetrahymena in each well.
  • Choose dilution that will allow you to count 10-30 cells/10ul drop.
  • Count at least 3 10u; drops of this one dilution.  Calculate average number of cells/ml.

Concentration of New Tetrahymena Stock Culture:

  • Use c1v1=c2v2 to calculate concentration.  (1×10^3)(20,000)=(4×10^4)(x)
  • Place 489ul of tetrahymena stock into a tube.
  • Next, fill the tube with PPT until it reaches 20ml.

New Concentrations:

  • Create 3 new experimental cells and 3 control cells.
  • In the experimental cells, add 912.5ul of Stock culture, and 87.5ul of NH4Cl.
  • In the control cells, add 912.5ul of Stock culture, and 87.5ul of H2O.
  • Count and record your cells in each well.
  • Store plates in designated drawer.
  • After 24 hours, add 20ul of iodine into each well and mix thoroughly.
  • Place 3 10ul drops of each well onto a concavity slide.
  • Count all 18 drops and record data.

Observations:

We observed Time at 0, control at 24 hours, and treatment at 24 hours.  After counting our cells we found the mean of each set of data.  The class data of the cells were counted and recorded onto a google sheets page.

Conclusion:

For conclusion, I have gained a lot of experience counting many cells.  NH4Cl had a negative affect on tetrahymena.  The average for the control groups were 34,600 cells/ml, and the average for the experimental groups were 24,200 cells/ml.

October 19

Lab 6-Ciliate Count Challenge and Effects of NaCl- 28 September 2017

Print Friendly, PDF & Email

Purpose:

This experiment taught us how to figure out the average, mean, and standard deviation of a set of data.  We got more work using micropipettes, and we were placed into our research teams.

Procedure:

  1. Before we started our experiment we worked on 6 practice problems to get more comfortable calculating percent concentration, molar concentration, and dilutions.
  2. Place 10ul of undiluted tetrahymena culture on a clean concavity slide.
  3. Observe and record data.  If observations are too many to count, dilute sample.
  4. To dilute sample place 10ul of tetrahymena culture into a capsule.  Then add 90ul of PPT using a micropipette and mix together using the vortex.
  5. Place 10ul of the diluted sample onto a concavity slide.
  6. Observe and record data.
  7. After recording your data, observe your lab partners’s and class’s data.
  8. Next, test NaCl to tetrahymena cultures by repeating the dilution steps 2-4.  This testing is done to calculate the minimum final concentration of NaCl before observing immediate fatal effects.

Results:

Diluted Samples:

In the diluted sample there were too many cells to count.  Once the solution was diluted 10^-1, we calculated the mean number of cells/ul to be 9 cells and 1800 cells/ml.  For our standard deviation we incorrectly calculated 0, but from this we now know how to correctly calculate standard deviations.

NaCl:

When we added .5ul of NaCl into an undiluted sample of 5ul of Tetrahymena, we observed lethal effects.  Once we diluted the tetrahymena 10^-1, we added .5ul of NaCl to 5ul of the diluted sample.  The tetrahymena remained alive.  We then added another .5ul and it had lethal effects of the tetrahymena.  Using the v1c1=v2c2 formula, we calculated and recorded that 9.09mM of NaCl is the minimal concentration.

.5ml x 100 = 5.5 x (x)

x=9.09mM

Conclusion:

This lab gave us the ability for further practice with micropipetting and dilutions.  The extra practice made it easier to avoid mistakes such as using a micropippette incorrectly.  It also gave us practice counting and calculating the mean and standard deviation of cells.

October 18

Lab 5- Serial Dilutions- 21 September 2017

Print Friendly, PDF & Email

Purpose:

The purpose of this experiment is to become better at using laboratory techniques such as calculating the concentration of cells by using serial dilutions.  We are also learning new techniques such as micropipetuting and how to complete serial dilutions.

Procedure:

  1.  Add 90 ul of PPT in 4 test tubes.  Make sure you are using the right micropipette.
  2. Take 10ul from the first test tube and add it into the second tube (10^-2).   Stir.
  3. Repeat steps by adding 10ul of the second tube into the third then stir and 10ul of the third tube into the fourth then stir.
  4. Place 5ul of all four dilutions (10^-1 to 10^-4) onto a clean concavity slide.
  5. Count and record number of cells in each 5ul droplet.

Data and Observations:

  • average cell counts/5ul
  • Average cells per ul in the drop
  • Average cells/ul in the undiluted sample
  • Average cells/ml in the undiluted sample

10^0

  • about 90/5ul
  • 18/1ul/drop
  • 1800/1ul/sample
  • 1800000

10^-1

  • 9/5ul
  • 1.8/1ul/drop
  • 180/1ul/sample
  • 180,000/ml

10^-2

  • 0/5ul
  • 0/1ul/drop
  • 0/1ul/sample
  • 0/ml

10^-3

  • 0/5ul
  • 0/1ul/drop
  • 0/1ul/sample
  • 0/ml

10^-4

  • 0/5ul
  • 0/1ul/drop
  • 0/1ul/sample
  • 0/ml

Conclusion:

This experiment made me familiar with micropipetting and creating serial dilutions which will be necessary in future experiments.

October 13

Lab 8 Data Analysis-10/12/17

Print Friendly, PDF & Email

Purpose:

The purpose of this lab was to gain experience using excel, and to learn how to use the data analysis function to do things such as make descriptive statistics, histograms, f-tests, and t-tests.

Procedure:

  1. We disposed of our cells in the lab with bleach and washed the wells.
  2. After that, we went into the computer lab to put our data on excel.
  3. We put in our information into excel and used the data analysis tool to find the descriptive statistics of all the treatments.

4. Next, we created histograms for all groups.

5.  After the histograms we ran the F-Test Two Sample for Variances.  The F-Test showed that the control and treatment had unequal variances.

6. Last, we ran the T-Test Two Sample Assuming Unequal Variances.  We used this to come to the conclusion that the null hypothesis was rejected.

Conclusions:

According to the T-Test, because P is greater than .5, the null hypothesis is not rejected.

September 19

Lab 4-Tetrahymena and Primary Literature Intro- 9/19/17

Print Friendly, PDF & Email

Purpose:

The purpose of lab 4 was to introduce us to primary literature and how to find it and use it to look at questions and ideas we may have for our future Tetrahymena experiment.  Through looking at primary literature we can get a better idea of how Tetrahymena are used in research.

Procedure:

  1. Place a drop of the Tetrahymena sample on a concave slide.  Place a cover slip over it.
  2. Observe this sample under 4x, 10x, and 40x magnification on a compound microscope.  Record your observations.
  3. To slow Tetrahymena movement, take the concave slide and put a drop of methylcellulose in your sample.  Record any new observations.
  4. After recording, rinse slide and put all materials away.
  5. Open up your labtop or go to the computer lab and download Zotero to keep all of your articles.
  6. Research topics for Tetrahymena experimentation and come up with a hypothesis you want to test.  Save your articles in Zotero.

Observations:

4x- Tetrahymena are very small and move very quickly

10x- About the same as the 4x observations

40x- Not able to see Tetrahymena but can see individual organelles.

Primary and Review Article:

Article Analysis: http://www.sciencedirect.com/science/article/pii/S0278691515000289

  1. Central question:  The central question of this primary article is questioning what the effects of melamine, a raw material, will have on Tetrahymena.
  2. Introduction Information:  Melamine is an organic compound that contains a large amount of nitrogen.  It is commonly found in plastics, decoration, paint, and paper industries, but it is banned in food.  Melamine is believed to be slightly toxic and can cause chronic toxicity.  Tetrahymena is a unicellular eukaryote that is often used as a study representative for protozoa and unicellular organisms.  Tetrahymena react very similarly to pollutants in the environment; therefore, it is commonly used to study toxicological issues.
  3. Design to Experiment:  1.  The Tetrahymena were first separated at 3500rpm for 20 minutes.  The sample of Tetrahymena was then introduced into a medium made of 15g tryptone, 5g yeast extract, and 1g glucose in 1000mL and cultured at 30 degrees Celsius for 72 hours.  2. Melamine was placed under ultraviolet germicidal irradiation an hour prior to use to make sure there was no microorganism contamination.  3. The medium is dispensed into 5 test tubes and each test tube was given 0, 0.005, 0.010, 0.015, and 0.020g of melamine respectively. The Tetrahymena strain  was then suspended at the density of 2×10^5 cells/mL.  100 uL of the suspended cell were inoculated into each test tube. The tubes were then cultured for 20 hours at 30 degrees Celsius while being constantly shaken at 220 rpm.  Another 5 test tubes were created as a control group with no melamine present.  4.  The Tetrahymena were counted under a microscope after the 20 hours using a hemocytometer.  The half maximal inhibitory concentration was calculated, and the experiment was repeated three more times.
  4. Questions about Results: Does the medium they were placed in have any effect on the proliferation rate? The results were that the number of Tetrahymena decreased as the amount of melamine present in the sample increased.  This shows that Tetrahymena are highly sensitive to melamine-induced damage. For mating purposes, this experiment showed that low concentrations of melamine (1-2 g/L) were mating at an increasing rate, but concentrations of melamine higher than 2 g/L caused a declining mating rate.
  5. Discussion:  The probable cause of why Tetrahymena’s mating rates increased with low dosages of melamine is because the melamine slightly damaged the genome of the Tetrahymena, so to compensate they mated quickly to makeup for the damaged genes.  Under high concentrations though, the genome was too damaged and the mating genes were also damaged so they were not able to repair the damage done. It is believed that the damage done to the genome was only applicable in high concentrations of melamine, and low concentrations of melamine showed negligible damage. The Tetrahymena’s self-repair capacity made up for the small amounts of damage done under low concentrations.

Review Article: https://www.ncbi.nlm.nih.gov/pubmed/28846184

  1. Central question:  How do poikilothermic organisms (ex. bacteria, fungi, etc.) maintain homeostasis in cold weather?
  2. Primary Findings:  These organisms adapt the lipid composition in their membranes to adapt to the weather change and maintain their membrane fluidity.  This is known as homeoviscous adaptation, and the main component of it is the composition of a acyl chain.
  3. Questions:  Is this way of maintaining homeostasis more effective than controlling our own body temperature?  What exactly are acyl chains?

Conclusion:

This lab gave me a good understanding of Tetrahymena, and I also got further practice using the microscopes.  This lab also showed me how to properly find and analyze primary literature, which was something very useful because I haven’t had much experience doing this.