February 9

Ludox Protocol 2/8/18

Print Friendly, PDF & Email

Title: Ludox Protocol Revised 2/8

Materials:

  • soil
  • Ludox
  • Glutaraldehyde
  • serological pipette
  • centrifuge

Procedure:

  • (pre lab: we practiced using a micropipette and a serological pipette)
  • Collect 5 grams of soil and add 10 ml of water. Mix for 5-10 minutes.
  • Allow the vial to rest for 1-2 minutes.
  • Transfer 3.68 ml of soil water into a glass tube.
  • Add 368 µl of glutaraldehyde (this should yield a 2% solution).
  • vortex the tube for 1 minute.
  • Inject 4 ml of the sample into a Ludox tube. (place p1000 at the 2 ml line)
  • Add the colored layer of water to the top of the Ludox layer
  • Place in a centrifuge at 4300xg for 15 minutes).
  • Extract the layer of cells from the Ludox tube.
  • Place the pellet of cells in a small, clean tube.

Mistakes:

  • Not adding the water carefully enough to the top layer
  • accidentally mixing the pellet layer with the water layer and Ludox layer

Results:

We were not able to finish the procedure so there are no results to report.

Data:

Mass of the Ludox test tube= 40.8 grams

Conclusion:

The next step would be to take out a sample from our tube and count the number of cells on a slide. Then we can begin the process for analyzing DNA. The method we used seemed to really help produce a clear and distinct layer of cells to analyze. I was not expecting to find such a pronounced layer. I also surprised to discover how many cells we had in our sample. We filled a total of 4 tubes with the pellet. The samples are labeled CPLMKC and they are on a rack.

February 2

Ludox Gradient Centrifugation 2/1/2018

Print Friendly, PDF & Email

2/1/2018, Ludox gradient centrifugation protocol

Purpose: The purpose of this lab was to revise our Ludox protocol to make it more efficient to yield better results. We will be using the Ludox method to extract cells for DNA analysis.

Materials:

  • Ludox
  • Gluteraldehyde
  • Grassland soil
  • centrifuge

Procedure:

  • Place 10 grams of soil and 20 grams of water in a baby food jar.
  • Mix for 5 minutes and let settle for 1 minute.
  • Add 900 µl (3 times) of soil juice into the Ludox at the 5 mL mark.
  • Add 2 mL of food colored water to the top layer of the mixture.
  • Weigh the tube on a scale (make sure that the weight matches the other group in your table!)
  • Centrifuge on 4300 g for 15 minutes.
  • Place in the refrigerator.
  • Draw 2 mL of the organic matter from the tube (pull from the top).
  • Take 5, 2 µl drops of the mixture in the tube and count the cells.
  • Calculate the efficiency.
  • Pellet out the cells in the microfuge tube by spinning at 1200 g for 1 minute.

Data: the weight of the Ludox tube was 23.1 grams

Results:

We were not able to complete the process so there are no results to analyze yet. Sources of error could come from not ensuring that the Ludox tubes at each table were the same weight. My groups Ludox tube did not match the weight of the other groups Ludox tube, so we had to add more water. This means that we added more water than the protocol initially called for.

Conclusion:

Since we have not finished the procedure, there is nothing to conclude yet. The next step would be to place our Ludox tubes in the centrifuge for 15 minutes, and then we will extract the cells for counting. We have also decided on a method to establish our control. We will add extra Tetrahymena to the same grassland soil sample we are using and repeat the Ludox protocol on this control group.

Where is it stored:

Our tube is labelled “CKL” on the side and it has our weight (23.1 g) listed on the cap. It is stored on a tube holder in the lab.

January 26

Ludox Centrifugation

Print Friendly, PDF & Email

Ludox Centrifugation, 1/25/2018

Purpose: Can we get cells out of the soil and if so, can this procedure apply to our protocol?

Materials: Ludox (wear gloves!), high power centrifuge, lower power centrifuge

Procedure:

1.Add 8ml Ludox HS 40 to a 15 ml conical tube.

2. Add 2 ml of liquid from the soil samples in the jars into the Ludox using a p1000.

3. Add 2 ml of distilled water (with red food coloring) to the top of the Ludox mixture.

4. Weigh test tubes (both at the lab table).

5.Centrifuge in a swinging bucket rotor for 15 min at 4300 x g.

6. Use a pipette to remove 3-5 ml layer of cells.

7. Place three drops of cells onto a concavity slide and observe under the microscope.

8.Transfer cells to a clean 15 ml comical tube.

9.Dilute with buffer to 10 ml and spin at 4300 x g for 10 minutes to wash and pellet the cells.

10.Remove the supernatant and store the pellet in the freezer.

Mistakes: Not adding the water carefully to the Ludox and accidentally mixing the water into the Ludox.

Results:

Our sample contained a couple of cells. I personally was not able to find a ciliate, but Camille and Katy each found one small ciliate (using a high magnification).This proved that our method for extracting cells was successful. Future steps would be to use this protocol when attempting to extract cells for our major experiment with classifying ciliates based on DNA sequencing. An unexpected finding would be the ciliate Dr. Adair showed us, which had formed a protective layer to remain dormant during the cool weeks. A source of error would be not being able to solely extract the cells from the test tube with the Ludox in it. There was no way to ensure that only cells were taken up by the micropipette. This may explain why some samples taken with the micropipette had ciliates, but others did not.

Storage:

Our sample is labeled CKL and has a smiley face drawn on the cap.

January 19

1/11/2018 Soil Diversity

Print Friendly, PDF & Email

Date/title:

1/11/2018, Soil diversity

Purpose: The purpose of this experiment was to observe the ciliate diversity in soil. We discussed the importance of soil diversity and the role soil organisms play in their environment. Soil diversity is important because it preserves nutrients, which is beneficial for agriculture.

Procedure:

  1. Take 10 μ of the liquid from the Burmuda grass using a micropipetter.
  2. Place the liquid on a concave slide.
  3. Place the slide under the microscope and search for various organisms.
  4.  Record your findings in a notebook.

Data:

I found one large ciliate. It moved sporadically and was in the shape of a peanut. I found about 20 tiny, round ciliates that moved very quickly.

Conclusion:

There was plenty of biodiversity in the sample, as expected. We already knew that their was a large population of ciliates, nematodes, and other organisms in the Burmuda Grass sample, but this experiment proved that this statement is still correct. Ciliates of various shapes and sizes were discovered. I was able to find other organisms, such as amoebas in the sample I took as well. As a whole, diversity enables various groups of organisms to thrive in an environment. A potential source of error could have been not measuring the proper amount of liquid taken from the Burmuda Grass sample.

Storage:

No sample was kept.

January 19

1/18/18 Metabarcoding presentations

Print Friendly, PDF & Email

1/18 research article presentations

Purpose:  To explore the primary literature concerning challenges in metabarcoding soil ciliates. The purpose was also to start brainstorming protocol ideas.

Procedure (ideas for protocol):

  1. collect a soil sample (NOT from a flower bed/an area with a lot of artificial fertilizer)
  2. Dry out the soil.
  3. Rehydrate soil via a flooded plate.
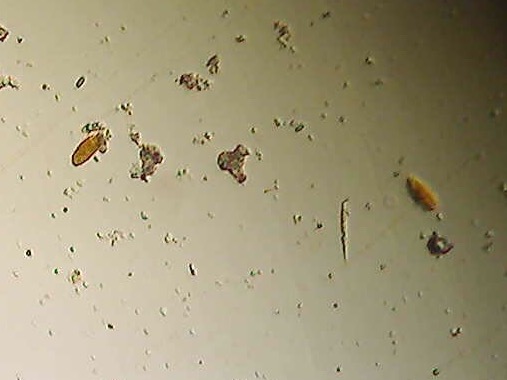
  4. Isolate the ciliates in your sample (using a micropipette).
  5. Place the isolated ciliates in the isopycnic centriguation to separate the ciliates.
  6. Select a primer (rDNA?)
  7. Sequence the DNA using a kit (such as NextGen Sequencing)
  8. Amplify segments of DNA (via Amplicon)

Results (protocol):

  1. Compare results with other information in the data base and attempt to classify your ciliates!

Group presentations:

Group 1- The authors looked at 5 estuaries in Australia. They focused on sequencing the DNA of the protists in each estuary. An application we can use for our experiment would be the pyrosequencing because it utilizes a lot of data at one time. The Molecular Operational Taxonomic Unit could be used to cluster DNA into groups. Some challenges these authors ran into, would be the limitation of DNA based monitoring and nonproportional data.

Group 2- We can use eDNA to eliminate potentially inactive or irrelevant DNA found. Amplicon is a way for us to see similarities in the chunks of the genome in the data base.

Group 3: The protists in various places throughout Europe were sequenced in order to get a picture of the biodiversity. The challenge with this experiment was that the authors were not able to make a standard sample. Each sample was too different from the next one.

Group 4: A gene named Cox 1 was specifically singled out to depict genetic diversity between closely related protists. When a population was separated via the founder effect, the authors noticed a large variation in the Cox 1 gene. This is because the new population had its own separate gene pool. The DNA was extracted using a master purification kit which we could potentially use for our experiment.

Group 5: Several organisms (protists and ciliates) were used in this experiment. The goal was to see if the  D1-D2 region was an ideal threshold for ciliates in their identification. An issue with this, is there may not be enough genetic material to work with. This article highlighted application of primers that we could use for our protocol.

Group 6: The authors of this article wanted to examine the effects of land use intensity on protists. I learned that both eDNA and rRNA are good ways to avoid obtaining unwanted inactive DNA. We can use the NextGen sequencing for our experiment as well. T-RFLP could be used after NextGen, to distinguish unique characteristics of ciliates.

Group 7: HTS (High-Throughput Sequencing) was used to sequence DNA. Dr.Adair informed us that this will not be applicable to our class because of the complexity of HTS. The issue with HTS was finding protists that matched one another.

Group 8: UniEuk is a metabarcoding system that is used to identify ciliates. The goal is to create a uniform taxonomy. Dr. Adair suggested that we start with B4 like the authors of this article.

Conclusions:

Protocols can be developed properly now that we have an idea of what to look for. We can learn from the challenges that the authors of the articles faced to make our protocol more successful. The class has developed a frame for what the protocol will look like and we have also familiarized ourselves with the terms for the equipment we will need.

There was no sample stored.


November 16

Ciliate Isolation and Characterization 11/16

Print Friendly, PDF & Email

The Ciliate Isolation and Characterization lab was performed on 11/16. The purpose of this lab was to isolate, identify, and take pictures of the ciliates found in our soil. Since I was unable to find any ciliates in my personal sample of soil, I used the Burmuda grass sample. I took 0.5 µl of water from the Burmuda grass and tried to find ciliates under the compound microscope. When I was able to identify ciliates, I placed 0.5 µl of Methyl cellulose and 0.1 µl of iodine on the concave slide. This enabled me to capture a picture of the ciliates more easily and I also could see some of the internal structures a litter clearer. Next I used moticonnect to take a picture of the ciliates I found. Initially, I tried to use the coverslip so I could get a more detailed picture of my ciliate, but that failed. I had to re-do the procedure of finding ciliates from the Burmuda grass and the second time around, I did not use the coverslip. It is difficult to see a lot of the internal features based on the pictures I captured, however I was able to identify the macro and micronucleus before taking the picture. The ciliates are extremely small and they moved very quickly. Based on the picture, I would estimate that the dark ring around the ciliates are the cilia. It is difficult to identify the ciliate based on the picture alone, but my best guess would be that these ciliates are nassophorea’s. The next step would be to gather all of my information and present it to my classmates. I do not have a sample stored.


November 9

Ciliate Classification 11/9

Print Friendly, PDF & Email

The Ciliate Classification lab was performed on 11/8. The purpose of this lab was to identify and classify our ciliates. Another objuective was to learn about evolution and we were introduced to the phylogenic tree. The goal of this experiment was for us to identify ciliates in our soil, and classify them based on morphological characteristics. The first step was to identify the soil texture. We measured the water, clay, and sand levels of our soil in the test tubes, using a ruler. The picture below shows the lines separating the water, clay, and sand. Next we calculated the percent of each component in the soil. My soil was 51.1% water, 15.6% clay, and 33% sand or sandy clay loam. After that, we began to identify our ciliates. We added a little bit more water to the plates, or enough water to create run off. Next we observed the soil under the dissecting microscope. I was not able to see any ciliates under the dissecting microscope, so I then took 15 μl of my soil and placed it on a concave slide. I attemped to observe ciliates under the compound microscope 5 times but I could not find any in each sample I pulled from my soil. Since I was unable to find any ciliates in my soil, I took a 15 μl sample from my partner, Evelynne’s soil. After 2 tries, I was able to find 1 ciliate. The ciliate was extremely small and oval shaped. There was cilia lined around the circumference of the ciliate. Possible sources of errors for my experiment could be just picking soil from the wrong location. My soil was very sandy and murky, so it was extremely difficult to see any ciliates. While I was not able to find any ciliates in my soil, I did learn about the evolution of ciliates, and I learned about the different classes of ciliates and their morphology. The next step for me would probably be to use a different soil sample and culture the ciliates in a different type of soil. My soil is stored in the middle drawer and it is labelled as LNMF1731.

November 2

Soil Ciliate Discovery 11/2

Print Friendly, PDF & Email

On 11/2 we performed the Soil Ciliate Discovery lab. The purpose of this lab was to determine the soil ciliate biodiversity within the soil samples. We learned about the role ciliates have in the soil ecosystems.  The first step of this experiment was to weigh our dried soil samples. The mass was 30.8 g with the petri dish and 25 g without the petri dish. The mass of the wet soil was 33.2g. Next I calculated the percent water content using the equation wet soil-dry soil/wet soil times  100. The wet mass was 33.2 g, so did 33.2-25 divided by 33.2, times 100 to get the water content, which is 24.6%. Next I placed 3 mL of my soil in a tube and added sterile water to the 8 mL line. I shook my tube for about 4 minutes and placed 1 mL of the liquid into a microfuge tube. I spun the tube for about a minute and added the liquid to a clean glass tube. I placed the pH strip into the tube and observed the color. The color of my strip was more blue, so my soil had a pH of 7 to 7.5. Next I added a drop of texture to my soil sample tube. I then added sterile water to my petri dish with soil. I observed my petri dish under a dissecting microscope, but I was not able to find any ciliates or organisms. Some sources of error could be having too much soil in the petri dish. I found it difficult to see anything in the dissecting microscope because my soil is very thick and muddy. There were not a whole lot of gaps to see any ciliates. Today we were not able to determine the texture of the soil, but after 24 hours I will be able to do so. My partner Evelynne had soil that was different than mine. We both had a lot of large clumps in our soil, but overall her soil was more thin than mine. Her soil was not as muddy as mine when she added water. The ciliates we find in the soil samples can tell us about the diversity of ciliates in the soil. It is possible we may find protists, algae, flatworms, and other organisms. This provides information about ciliate abundance. My next step is to see if there are any ciliates in my petri dish tomorrow, and to figure out what the texture of my soil is. My soil is stored in the first lab table the the second drawer. It is labelled as LNMF1731.

October 26

Figure Presentation 10/26/2017

Print Friendly, PDF & Email

Figure Presentation 10/26/2017: The picture below is a bar graph of the means for the Tetrahymena count for the treatment and control groups of the 1 µl insulin treatment. The insulin concentration is 6×10^-14 µmol/mL. The p-value is 0.226709, which indicates why the null hypothesis cannot be rejected. The p-value must be less than 0.05 to reject the null hypothesis. Since 0.226709 is not smaller than 0.05, the null hypothesis is not rejected, which indicates that there is no significant change. The sterile water bar is smaller than the insulin bar. The 10 and 100 µl groups all rejected their null hypothesis because their standard error bars did not overlap. This indicated that the insulin made a significant impact on the Tetrahymena, and the sterile water bar was higher than the insulin bar on their graphs. The purpose of the figures or bar graphs, is to help us to anaylze the data we have collected from our experiment and determine the significance of our findings.

Draft: The purpose of the rough draft was to get a framework down and have an idea of what our final paper will look like. In my draft, I included my groups final figure (for 1 μl) and tables that displayed our data (such as T-test, p-value, and mean). I also made sure to include references to different publications. One of my references include research about the affect bacteria has in insulin, so I suggested further study on this in my “Future Research Suggestions” portion of the rough draft.


October 19

Figures 10/19

Print Friendly, PDF & Email

Purpose: The purpose of this lab is to create a figure that represents our results.

Procedure:

  1. Enter all of the data into the correct column.
  2. Click on the insertion tab
  3. under Extra Graphs, then statistics is the box plot.
  4. Using only the 1 microliter control and treatment group, use the box plot to show the data.
  5. click on the graph tab
  6. under Graph Title, change the box plots title to “Tetrahymena Ciliate Counts: 1 microliter”
  7. Under Graph Axes horizontal, change the axis title to “Control vs Treatment”.
  8. Under Graph Axes vertical, change axis title to “Ciliate Count”.

Figure a

Conclusion: The graph shows that the blue bar is control and the orange bar is the treatment group. This graph proves that the number of tetrahymena increased from the treatment of insulin, since the treatment bar is higher than the control bar. The blue and orange dots represents the outliers.