Figure Presentation 10/26/2017
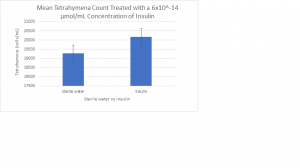
Figure Presentation 10/26/2017: The picture below is a bar graph of the means for the Tetrahymena count for the treatment and control groups of the 1 µl insulin treatment. The insulin concentration is 6×10^-14 µmol/mL. The p-value is 0.226709, which indicates why the null hypothesis cannot be rejected. The p-value must be less than 0.05 to reject the null hypothesis. Since 0.226709 is not smaller than 0.05, the null hypothesis is not rejected, which indicates that there is no significant change. The sterile water bar is smaller than the insulin bar. The 10 and 100 µl groups all rejected their null hypothesis because their standard error bars did not overlap. This indicated that the insulin made a significant impact on the Tetrahymena, and the sterile water bar was higher than the insulin bar on their graphs. The purpose of the figures or bar graphs, is to help us to anaylze the data we have collected from our experiment and determine the significance of our findings.
Draft: The purpose of the rough draft was to get a framework down and have an idea of what our final paper will look like. In my draft, I included my groups final figure (for 1 μl) and tables that displayed our data (such as T-test, p-value, and mean). I also made sure to include references to different publications. One of my references include research about the affect bacteria has in insulin, so I suggested further study on this in my “Future Research Suggestions” portion of the rough draft.

