February 2

Lab 4: Protocol Modification 2/1/18

Print Friendly, PDF & Email

Objective:

The goal of our lab is to work together as a group to incorporate all of our ideas to create a more standardized procedure that can be replicated in other research labs. By going through this process of creating a more efficient protocol, we hope to be able to successful extract DNA from ciliates and classify them.

Purpose:

The purpose of today’s lab is to come up with new ideas in order to create a more efficient Ludox protocol that would allow us to continue our ciliate metabarcoding process. We hope to create a more standardized protocol with a control that will allow us to compare the Ludox process to samples that are positive for ciliates and our samples.

Procedure:

*We came together as a class and shared our ideas for a modified Ludox protocol.

Modified Ludox Protocol-

1.) Weigh out 5 grams of soil in a glass jar and make sure you screen in for large debris.

2.) Add 7mL of water and mix for 5-10 minutes using the vortex.

3.) Pipette (cut the the tip of the pipette tip so you can get more of the sample without it getting clogged with debris) 1800 micro-liters of the watered down soil sample to mix with 200 micro-liters of a 25% glutaraldehyde solution and vortex briefly.

4.) Quickly inject 2mL of the fixed sample into the Ludox tube by placing a p1000 micro-pipette tip at the 6mL mark on the tube to ensure the soil gets into the Ludox.

5.) Carefully layer the top of the Ludox with 2mL of distilled water that has been dyed with one drop of red food coloring.

6.) Label your test tube.

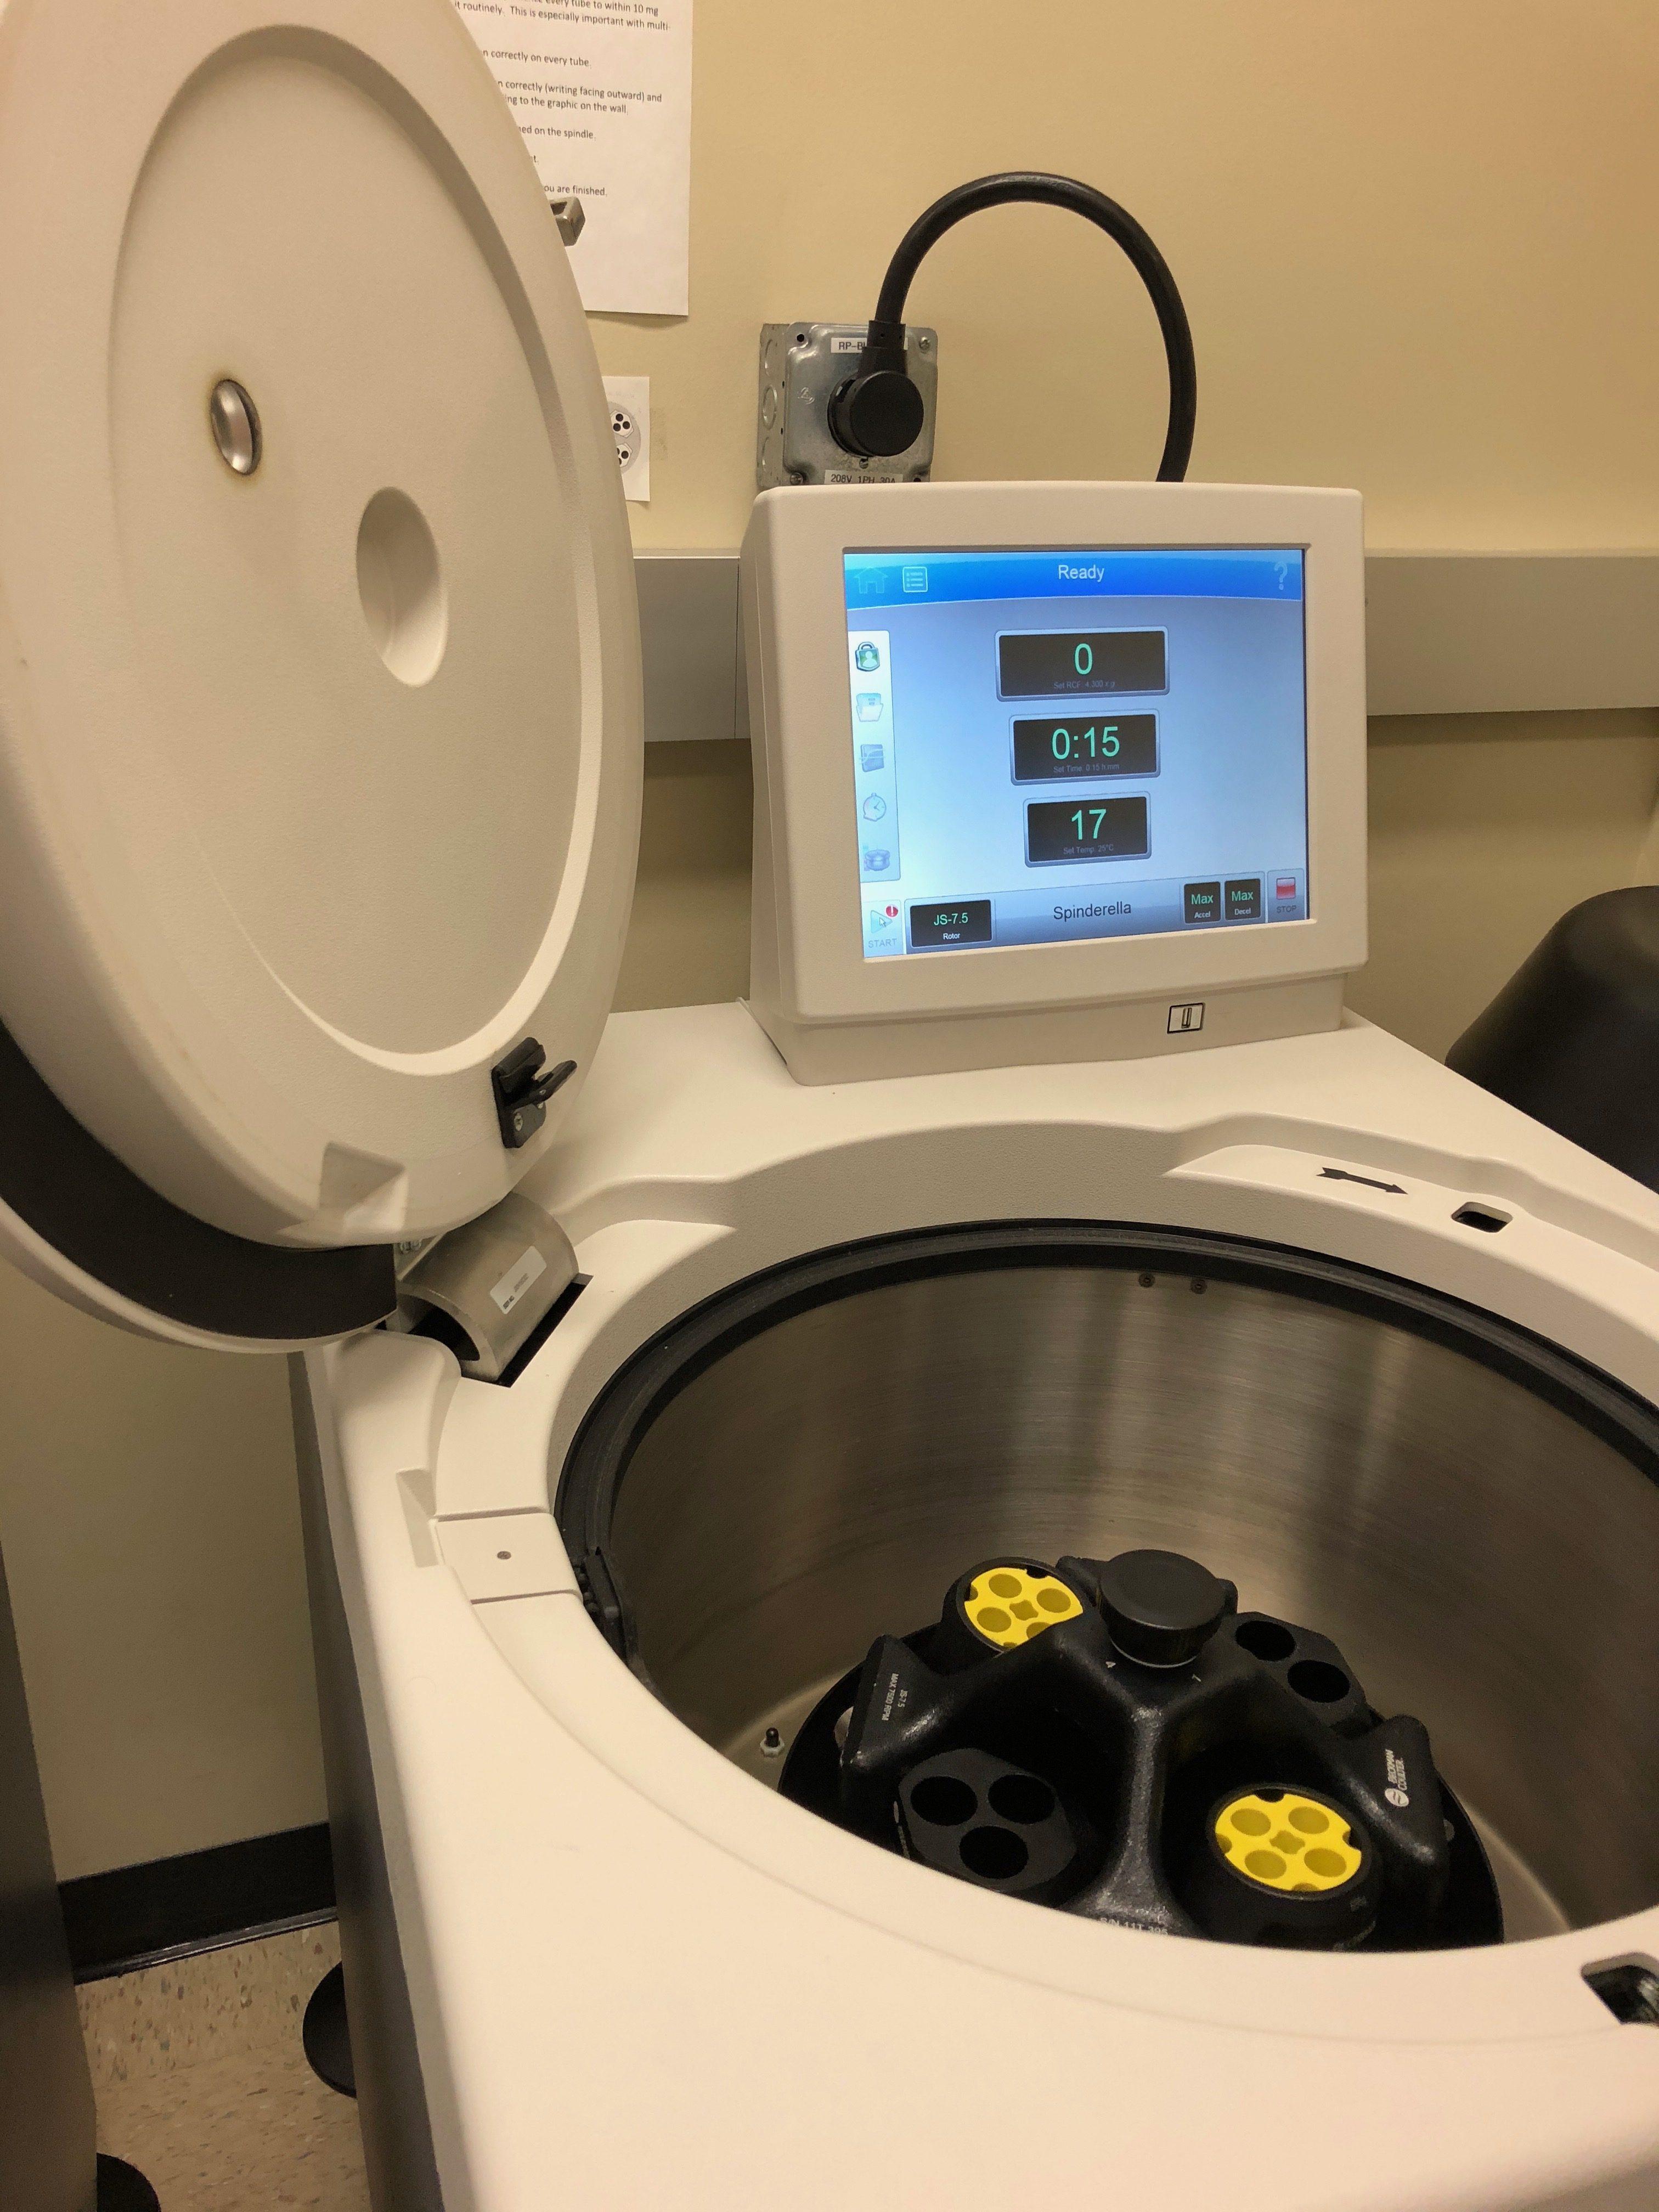
7.) Centrifuge at 4300 x g for 15 minutes.

8.) Remove 2mL of the organic layer of soil from the tube using a pipette.

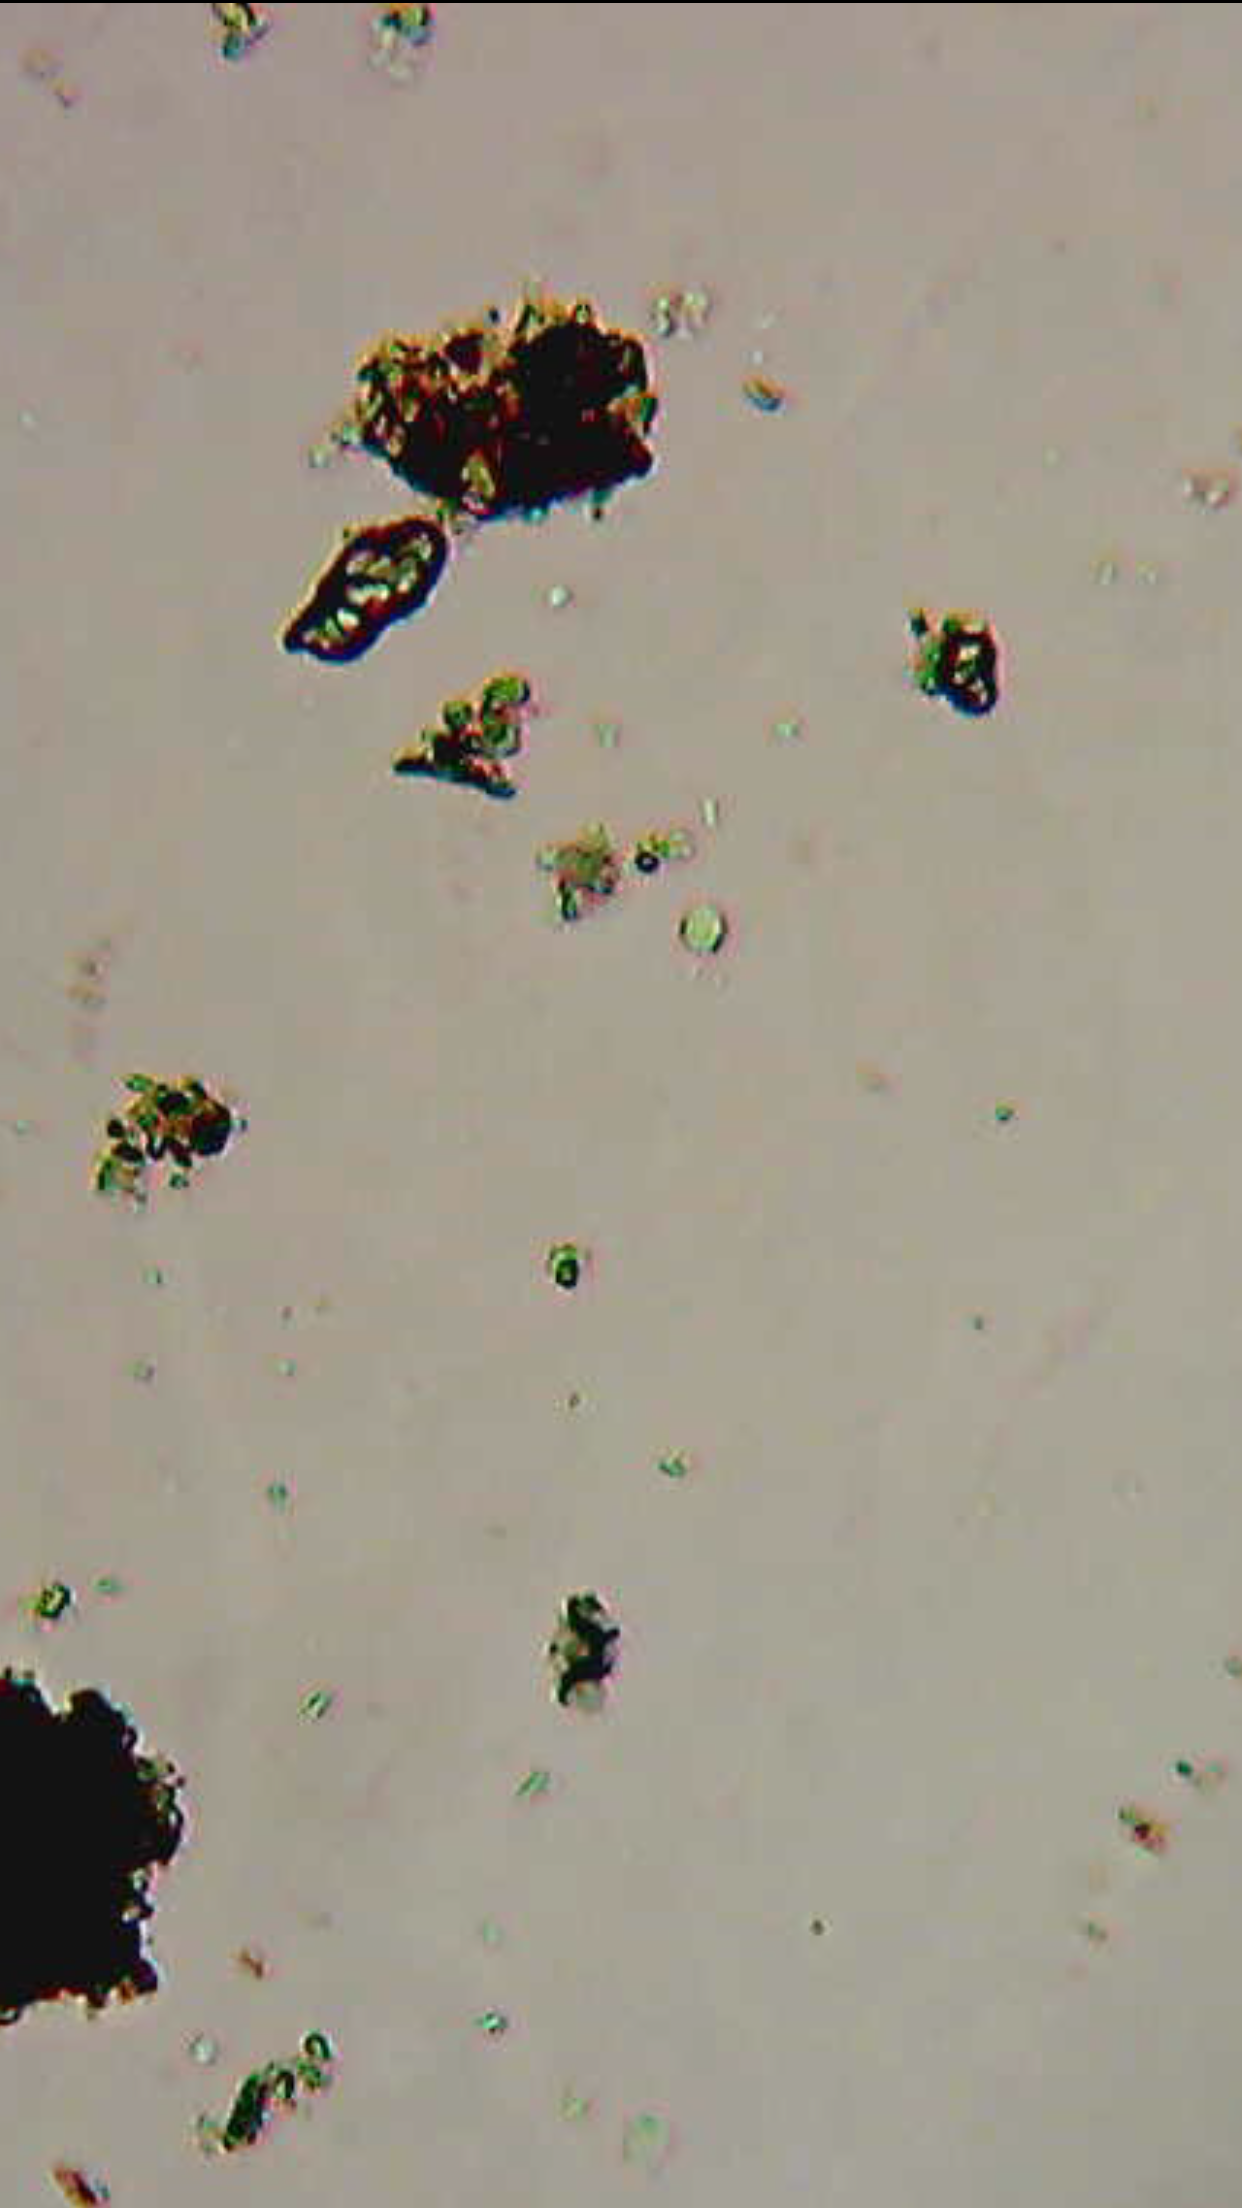
9.) In order to see how many cells are present, pipette out 5, 2mL drops onto a concavity slide and count all ciliates presents. Take an average of how many cells were present within the the five drops and record it to later be typed in a class data sheet.

10.) Then use the table top centrifuge and spin the 2mL tubes at 15,000 x g for one minute.

11.) Remove 1000 micro-liters of supernatant with a p1000 micropipette twice so you get a total of 2000 micro-liters. Leave a small layer of liquid in the tube to ensure you don’t pipette out the pellet (5-10 micro-liters is okay).

12.) Freeze the DNA for extraction (stored in freezer).

Note: In lab today, we only got up to step 7 and we will continue the procedure during the next lab session.

Control Procedure:

1.) Add five grams of autoclaved soil into a jar.

2.) Add 2mL of the Tetrahymena culture (about 2000 cells) and 5mL of water into the the jar containing the soil.

3.) Calculate the extraction efficiency: starting [cell] – extracted [cell] / starting [cell].
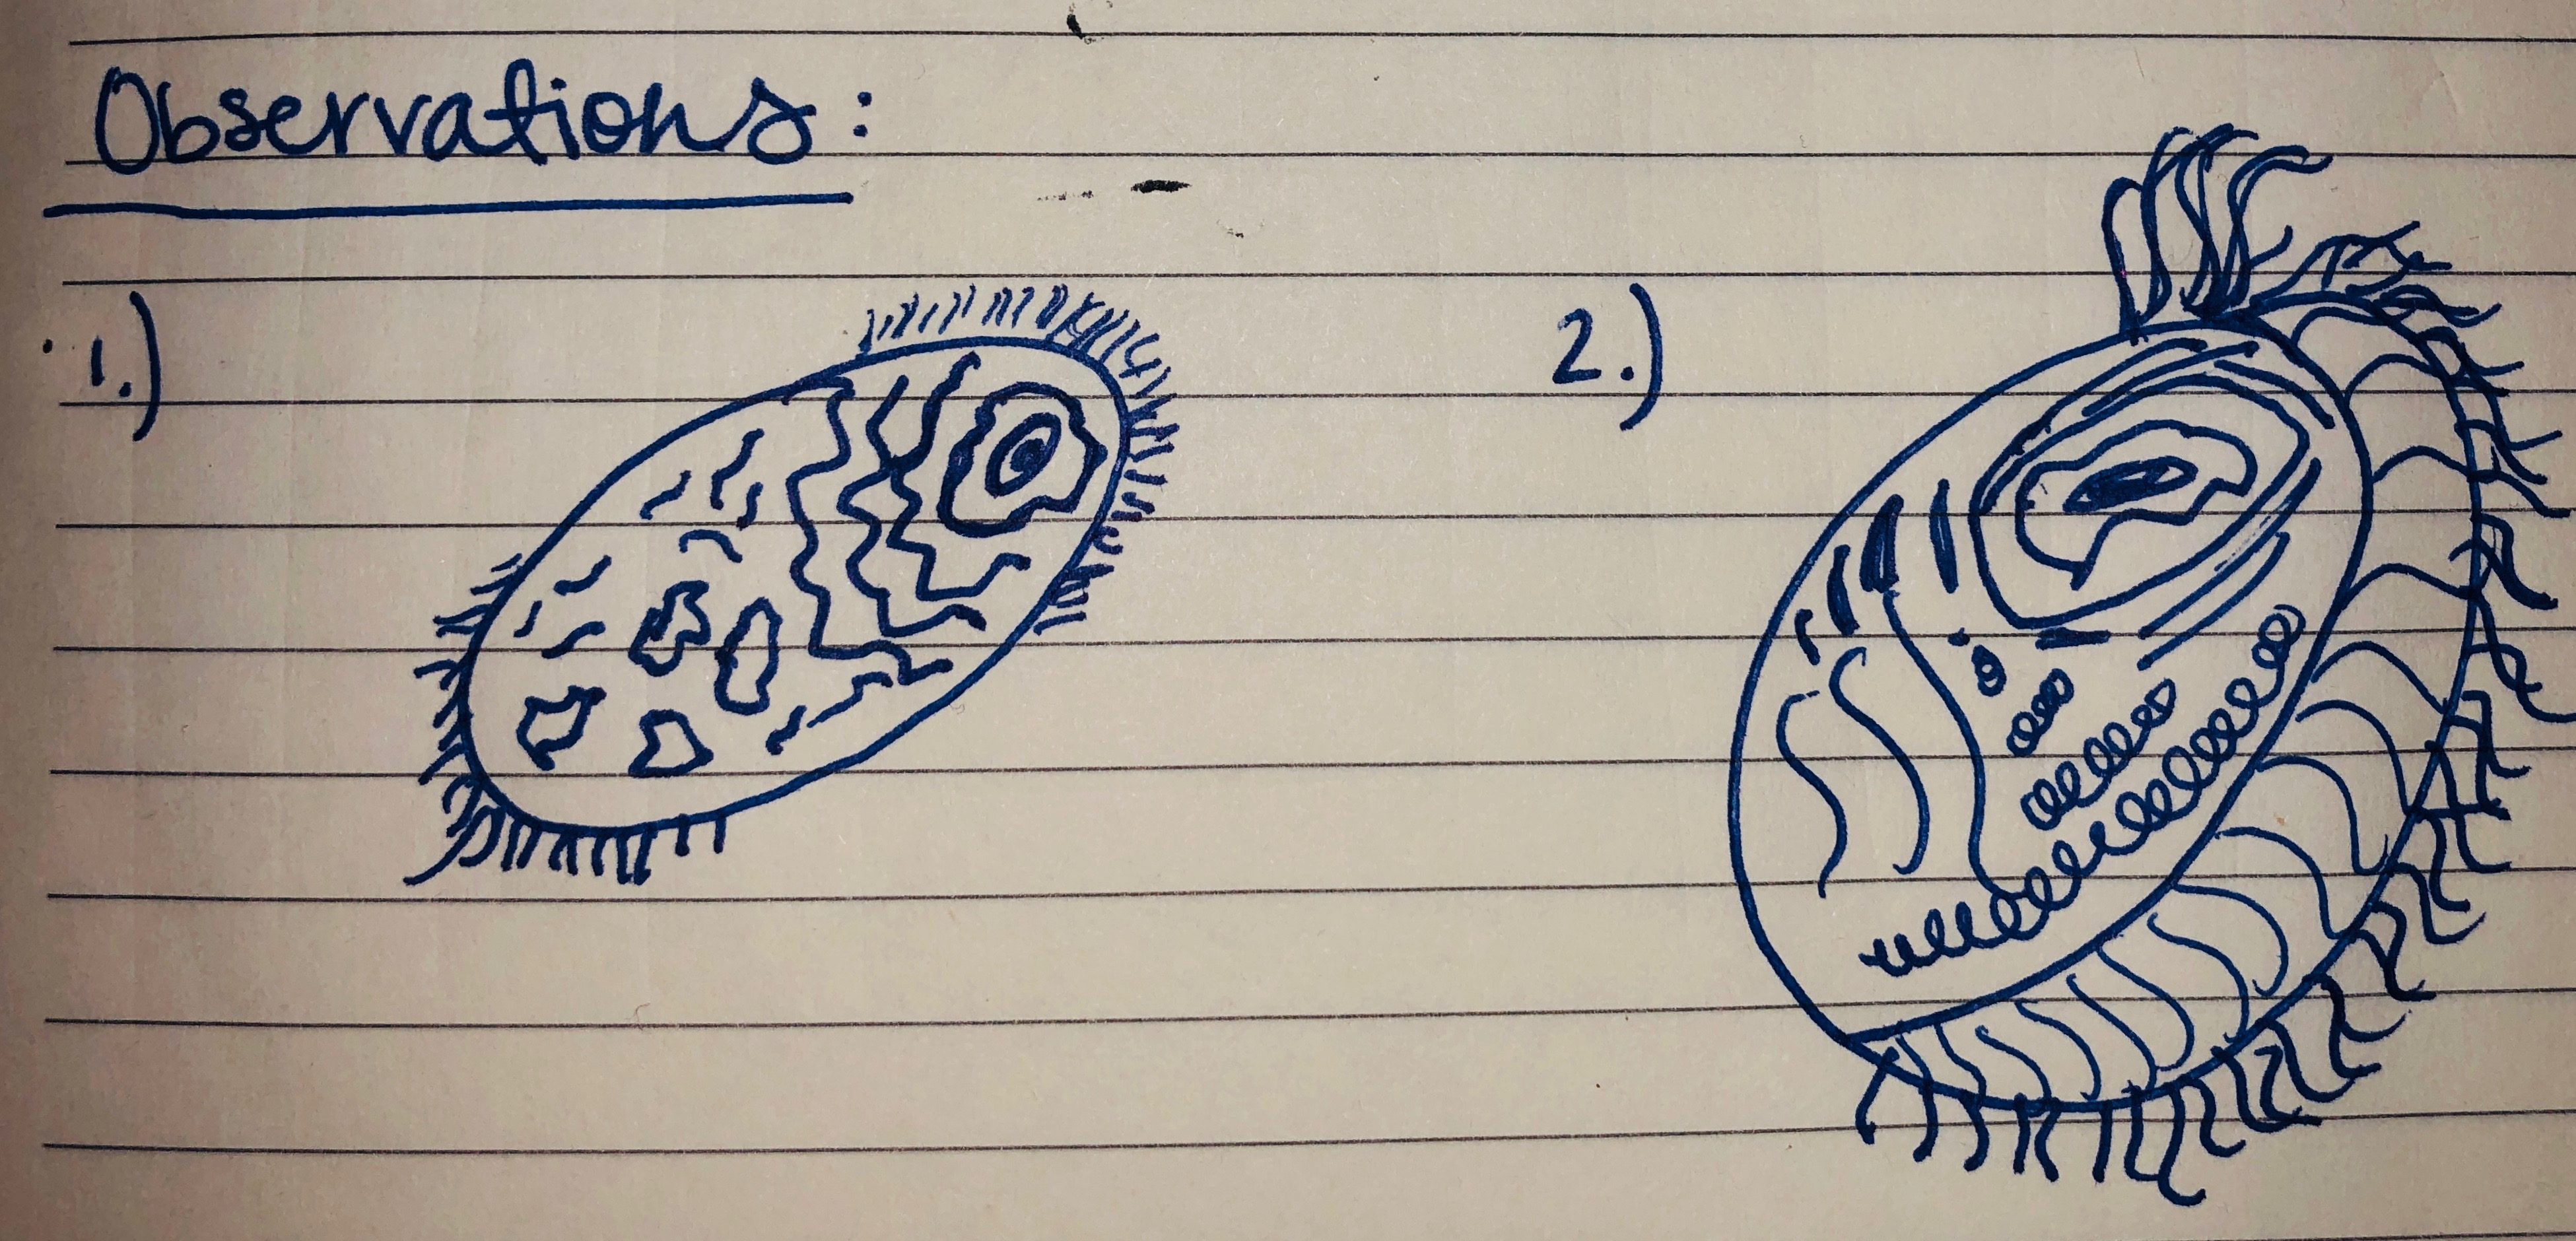
Data/Observations:

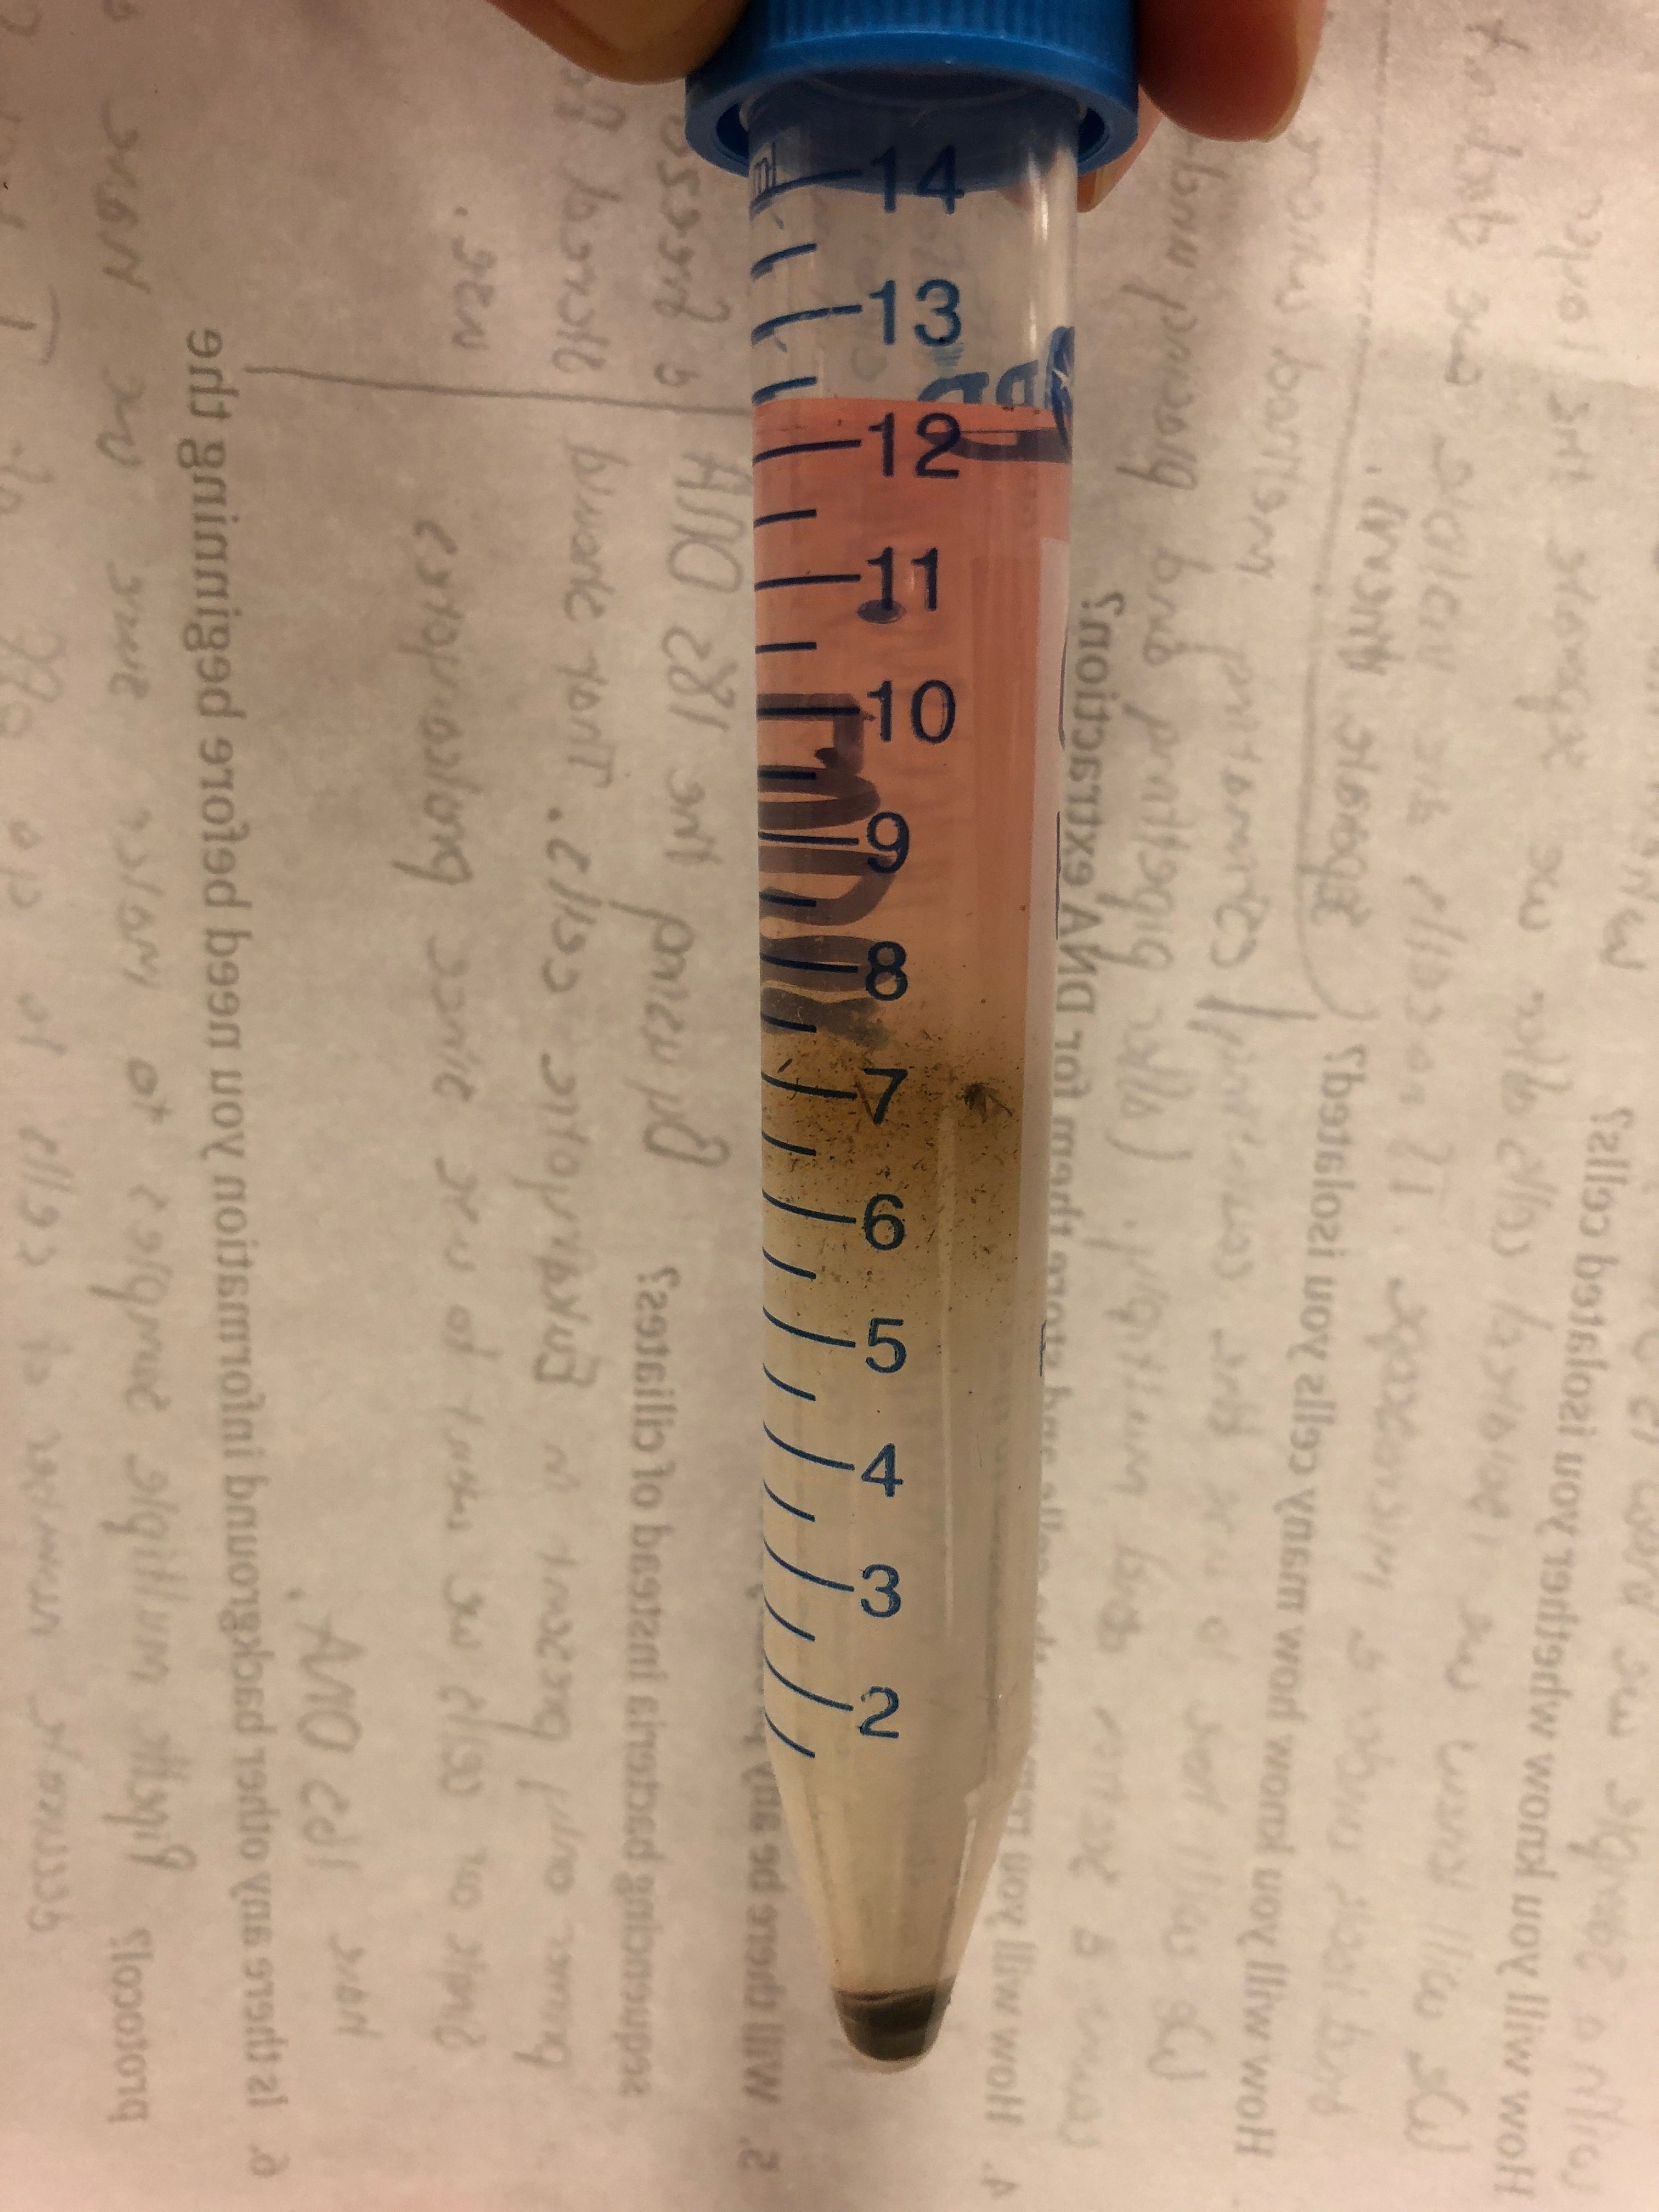
Test Tube Weight: 20.8 grams
Weight of Soil in Jar Sample: 5.0 grams
Test Tube Contained: 8mL of Ludox

I noticed that our test tube did not have as distinct separation between the ludox and the soil sample as other groups did. The soil sample and the ludox seemed to mix with each other, even after letting the sample settle, the liquids did not separate.

Storage:

Our test tube is currently labeled “G #5” to symbolize “group number five” and was placed in a yellow rack with all of the other tubes to begin centrifugation. In order to be put in the centrifuge we had to make sure that the other group that sits at the same table as ours had a test tube weight within .1 grams of ours. Once they were the same weight or within this amount then we were able to place them in this rack that was on the back lab counter closest to the computer.

Future Goals:

In the future we hope to establish a protocol that can be easily replicated and used in many other experiments related to metabarcoding. Due to the fact that today was more of an editing day and trying out part of our new procedure, we are trying to see if our new modified protocol will work better than our previous procedure. If it works we can continue the process but if it doesn’t give us the results we want we will most likely go back to the drawing board and brainstorm more ideas that we think could give us the results we want.

January 26

Lab 3: Protocol Development and Ciliate Isolation 1/25/18

Print Friendly, PDF & Email

Objective:

The goal of today’s lab is to develop a protocol that can help us as a class and the scientific community isolate and identify ciliates through metabarcoding. We hope to successfully develop an easily repeatable procedure that it produces significant results. A main part in this is brainstorming multiple procedures to see what would work best which helps us get one step closer to our goal.

Purpose:

The main purpose of lab today and all of our previous labs is to use the Ludox gradient centrifugation technique to isolate cells and extract DNA. We are trying to standardize a metabarcoding method that will include next ten sequencing using 18s DNA primers to identify the eukaryotes present in any given sample. The purposing of using the 18s DNA primers is to ensure that we can easily differentiate between eukaryotes and any prokaryotes present.

Procedure:

1.) Add 8mL of Ludox US 40 to a 15mL conical tube.

2.) Quickly inject 2mL of liquid from the soil samples in the glass mason jars into the tube of Ludox using a p1000 micropipette.

3.) Add 2mL of distilled water (colored with red food coloring) to the top of the Ludox and make sure that you DO NOT mix it into the rest of the solution.

4.) Weigh your conical tube on a scale and compare it to your neighboring group and make sure that the weights of each conical are within 0.1 grams of each other in order to properly prepare the sample to be placed into the centrifuge.

5.) If the tubes are unequal in weight and not within 0.1 grams of one another, place the conical tube open into the jar on the balance (make sure the jar weight had been zeroed out before weighing the conical tube) add more distilled water to the one that was less weight until it is within 0.1 grams of the other one.

6.) Label your conical tube with you group number.

7.) Walk up to the third floor MBC laboratory and view the equipment and learn about the difference between a normal centrifuge and a swinging bucket rotor centrifuge.

8.) Centrifuge in a swinging bucket rotor for 15 minutes at 4300 x g.

9.) While waiting for the centrifuge, brainstorm possible positive and negative controls with your group as well as determine the work flow of today’s experiment.

10.) After the centrifuge cycle is complete, remove the tube from the centrifuge and use a pipette to remove the cell layer which should be in between the Ludox at the bottom of the conical tube and the distilled water sitting on the top layer of the conical tube.

11.) Transfer as much of the cell layer as possible into a clean micro-centrifuge tube.

12.) Label your micro-centrifuge tube with your group number.

13.) Pipette 1-3 drops of the micro-centrifuge sample onto a concavity slide to review under a compound microscope.

14.) Try to locate any possible ciliates using the microscope, if possible take pictures using the MotiConnect app.

13.) Place micro-centrifuge tube in the centrifuge and spin the cells at 1200 x g for 1 minute.

14.) Take out your tube then use a pipette to remove all of the supernatant trying carefully not to disturb the pellet.

15.) Leave the pellet in the tube for the next experiment.

Data/Observations:

This is the conical tube after being taken out of the centrifuge with swinging bucket rotors. The solution separated into three layers, the top was distilled water mixed with red food coloring, the middle was were the majority of the cells were which also contained any debris from the sample, and the bottom layer was the Ludox US 40.

Original Weight: 21.1 grams
weight After Making it within 0.1 grams of the Neighboring Group: 21.3

This is a centrifuge with a swinging bucket rotor which was spun at 4300 x g.

Current Storage:

We placed the micro- centrifuge tube containing the pellet on the back lab counter closest to the computer in an orange rack which will be stored in the freezer until further use.

Future Goal:

The future goal that we would like to establish a concrete metabarcoding protocol that can be used throughout the scientific community to help isolate and classify new ciliates so that we can further our knowledge about soil health and biodiversity.

January 19

Lab 2: Discussing Scientific Literature 1/18/18

Print Friendly, PDF & Email

Objective:

Our goal that we hope to achieve from reviewing scientific literature is that we may eventually create a protocol for metabarcoding that we may implement in our own lab setting. We hope to extract the DNA, perform PCR and gel electrophoresis with a multitude of primers in a sufficient and cost effective way.

Purpose:

The purpose of lab today was to learn about different protocols for metabarcoding that are currently in use and protocols that are in the design process so that we can determine the best ways to sequence the DNA that will help us classify new unknown ciliates efficiently.

Procedure:

1.) Be prepared to present your presentation about the scientific literature that you read with your group.

2.) If you are not currently presenting, listen to the other groups and take notes on the protocols they researched and whether or not they are effective.

3.) While you are listening to other people’s presentations, think about a possible protocol that can be used in lab and what are the advantages and disadvantages to that protocol.

Data/Observations:

Group 1-
-Review Article
-Used standardized genetic markers (18s rRNA)
-Current system of taxonomy discussed does not have enough species to cross reference new species making it harder to identify unknown ciliates

Group 2-
-Review Article
-Use standard application primers
-Databases: BLAST and MUSCLE
-Chimeric sequences

Group 3-
-Primary Article
-This research discussed looking for similarities on the DNA of Avian microbial parasite and human microbes to see whether it was zoonotic
-V4 DNA extraction method
-Found best results at 37 degrees Celsius using a heating and cooling method as well as Sanger sequencing

Group 4-
-Primary Article
-Used the cox1 taxonomic marker which easily identifies closely related species
-More specific results is using the 18s rRNA instead of 12s rRNA
-Isozyme Mobility

Group 5- This was my group and the information I learned from my article can be found in my previous journal entry.

Group 6-
-CO1 subunit can be amplified in ciliates and can determine a specific cut off value of genetic diseases
-CO1 gene can be used a barcoding marker and to discriminate between closely related taxa
-Chelex Method and M13 Forward and M13 Reverse was used when sequencing the DNA

Group 7-
-Used mobile kits where the cell was extracted and a salt suction was centrifuged with the cells to the DNA
-The kits only used 500bp when sequencing their DNA because it was easier to run it in with smaller bursts
-It was difficult to analyze the enormous amounts of results and then further interpret them because they were not able top cross reference them with already known taxa

Group 8-
-pH can be a affect in this genetic sequencing and be just one of many environmental variables
-Heterogeneous diversity
-EukA7F and Euk570R primers
-Alpha diversity/Beta diversity
-Used “Quime” software

Current Storage: No physical lab work took place today but all presentations are uploaded on canvas

Future Goal:

We hope to be able to construct our own protocol for metabarcoding that were could actually implement in lab. If we are fortunate, this procedure may allow other sections of this lab in future year to repeat this process and gain more specific results.

January 18

Lab 1: Introduction to Metabarcoding 1/11/18

Print Friendly, PDF & Email

Objective:

The main goal of lab today is to learn about metabarcoding and how it relates to science and the scientific process. During lab we aim to review scientific literature to understand current protocols that have already been set in place by other known scientists so that we may concoct one that will optimize our time during lab this semester.

Purpose:

It is important that we fully comprehend the scientific literature that we are reading because the goal of lab is to create our own metabarcoding protocol that we can apply to ciliates. Learning about metabarcoding with help us to further implement a procedure that can help us better understand soil ciliate diversity and why is important.

Procedure:

1.) Obtain a concavity slide, a 10 microliter micropipette, a sample from the Bermuda grass community, and a compound microscope.

2.) Pipette a 10 microliter drop of the Bermuda grass sample on the concavity slide and place under the microscope.

3.) Use a cover slip and vaseline to place on top of the concavity slide in order to use the microscope at its highest power.

4.) Try to focus the microscope to see any ciliates present in the sample.

5.) Draw/Record your observations; if possible try to identify any ciliates you can if found in the sample.

6.) After viewing the ciliates, clean up your lab station and locate the piece of scientific literature that has been assigned to your group, as well as a questions that matter worksheet that will need need to be filled out in order to brainstorm your groups’ presentation.

7.) Converse with your group members about the article and metabarcoding and brainstorm possible protocols.

Data/Observations:

Ciliates Seen-

Scientific Literature-
I learned about environmental DNA sampling and analysis and how you can isolate a single strand of DNA and extract it for a process called Sanger Sequencing. The most common procedure is metabarcoding which uses 18s rDNA which works for Next Gen Sequencing, but is not effective enough to differentiate between interspecies relationships.

Current Storage:

Today during lab we cleaned up our lab stations and did not store anything. We worked on our presentations for lab next week.

Future Goal:

After reading all of this scientific literature, we hope to uncover the best protocols for the metabarcoding process so that we will be able to implement this process on our own in lab. Once we create/find the best protocol we should be able to sequence DNA extracted from the ciliates.

Source Citation:

Pawlowski, J., Audic, S., Adl, S., Bass, D., Belbahri, L., Berney, C., . . . Vargas, C. D. (2012). CBOL Protist Working Group: Barcoding Eukaryotic Richness beyond the Animal, Plant, and Fungal Kingdoms. PLoS Biology, 10(11). doi:10.1371/journal.pbio.1001419

November 29

Lab 13: Identifying Ciliates 11/16/17

Print Friendly, PDF & Email

Objective:

The goal of today’s lab was to see if we were able to view any ciliates from the new culture of ciliates. The goal of today was to mainly observe whether or not we had successfully isolated ciliates from our non-flooded plates and if they had effectively been cultured. If we were not able to see any ciliates we had to go back to our non-flooded plates and repeat the process stated in lab 12.

Purpose:

The purpose of lab was to be able to view ciliates that we had isolated from our soil and possibly identify/ classify them. This would be helpful practice for identifying ciliates or even trying to identify some specific features of the ones that were able to be observed under the microscope.

Procedure:

1.) Retrieve the well plate with cultured ciliates.

2.) View the whole well under a dissecting microscope to see if any ciliates are present within the well.

3.) If ciliates were present within the well, pipet ten microliters onto a concavity slide and view under a compound microscope.

4.) If there were no ciliates present within the well, retrieve the non-flooded plate and try to isolate and extract a ciliate from that sample.

5.) Once a ciliate is able to be seen under a microscope, try to classify and and identify the ciliates present.

6.) Try to capture an image of any of the ciliates that can be seen under the micro scope.
Note: Some ciliates may be too small to identify using the compound microscope.

7.) These images should be used during your group presentation of your findings during this experiment.

Data/Observations:

I observed a few ciliates that were too small to identify and could best be seen using 100x on the compound microscope. The ciliates I had seen were more oval shaped with very distinct organelles within due to its transparent body.

Current Storage:

My non-flooded plate and 24 well- plate are labeled with my soil identifier, KSA31F17, and are located in the left back desk in you are facing the projector in the second drawer on the front side of drawers closest to the next lab table. The falcon tube that was used to calculate the soil texture in located back in the teal- green tube stand with the other students tubes on the back lab counter closest to Dr. Adair desk top computer.

Future Goal:

I hope to be able to collect more soil samples in the future and be able to identify more ciliates or at least classify the group that the ciliate belongs to. I hope to use my knowledge I gained from this lab for any future research career that I choose to pursue.

November 9

Lab 12: Ciliate Classification 11/9/17

Print Friendly, PDF & Email

Objective:

The objective of this lab is to apply core concepts of evolutions, classifying ciliates using phylogenetic trees as well as determine the soil texture of our samples. The main goal of this specific lab is to eventually improve these phylogenetic trees and our understanding of the diversity of life within the ecosystem.

Purpose:

The purpose of lab today is to observe and understand how ciliate populations evolve and how the change in genetic composition effects the population over time. We hope to eventually see how populations evolve when individuals with different genotypes survive and reproduce at different rates.

Procedure:

1.) Retrieve your falcon tube from the teal-green rack and use a ruler to measure the amounts of sand, silt, and clay within the tube because everything has settled by now. Measure the total amount of sand, silt, and clay as well as take individual measurements of each ()this will help to calculate soil texture).

2.) Calculate soil texture by dividing the individual measurements of sand, silt, and clay by the total measurement of all three of them and then multiply that number by 100 to find the actual percentage.

3.) Retrieve the non- flooded plates created from the previous lab and observe them under a dissecting microscope. Use the microscope to see if there are ciliates resent within the water of the soil sample. Try your hardest to find anything that may resemble a ciliate and if you are unsure ask Hope, Felicia or Dr. Adair to check.

4.) Once you have a found a ciliate or multiple ciliates, using a p10 to micropipette ten micro-liters of the soil sample where you viewed the ciliate on to a concavity slide. It may take multiple tries to successfully capture the ciliate viewed on the microscope into the ten micro-liter extraction.

5.) On the concavity slide with the ten micro-liter drop containing the ciliate from your sample, use a compound microscope to ensure that you in fact have a ciliate within that sample and that it is visible under this microscope.

6.) Once you know that you for sure have atleast one ciliate within your ten micro-liter sample on the concavity slide, obtain a twenty-four well plate.

7.) In one well of the well- plate, pipet five hundred micro-liters of the protozoa pellet solution and then add as much of the ten micro-liters from your concavity slide as you can into the same well on the well- plate. This will help to culture any ciliates present in your sample.

Data/ Observations:

Soil Texture-

  • Percent Sand: 85.72%
  • Percent Clay: 9.52%
  • Percent Silt: 4.76%

    I saw a couple nematodes within my original soil sample and there was some rapid movement from very small organisms. I think that these very small fast organisms swimming in the water were ciliates. There were about 3-4 ciliates present but they were so small it was difficult to tell/ It was hard to focus on them under the compound microscope because they were transparent and round and could easily have been mistaken as tiny particles of dirt. As I viewed the sample using a higher power under the microscope, it became more clear that they were ciliates and they were so transparent that they were difficult to differentiate from the water they had been swimming in.

    Current Storage:

    My non-flooded plate and 24 well- plate are labeled with my soil identifier, KSA31F17, and are located in the left back desk in you are facing the projector in the second drawer on the front side of drawers closest to the next lab table. The falcon tube that was used to calculate the soil texture in located back in the teal- green tube stand with the other students tubes on the back lab counter closest to Dr. Adair desk top computer.

    Future Goal:

    In the future I hope to be able to actually identify the ciliates that I discovered in my soil sample. I would also like to be able to classify them as well as know what type of ciliate group they belong to and where they would be located within the ciliophora subsection of the phylogenetic tree. I hope that I will be able to conduct more research regarding ciliates in the future and eventually understand how they contribute to our ecosystem.

  • November 9

    Lab 11: Soil Ciliate Discovery 11/2/17

    Print Friendly, PDF & Email

    Objective:

    The objective of today’s lab was to measure soil characteristics as well as ciliate diversity and abundance. Our goal is to understand where and how ciliates get their nutrients and to possibly identify what environments make it possible for them to thrive.

    Purpose:

    The purpose of lab is to be able to calculate soil water content, create non-flooded plates and determine the pH of the soil. After learning how ciliates function and knowing what environments have the most diverse groups of ciliates we will be able to possibly understand their true functions and why they are a vital part of the ecosystem.

    Procedure:

    1.) Retrieve your original soil sample that was collected during the first week of class from the drawer the that it is located in (if you do not remember where you put it, check the first entries of your lab journal and should be noted somewhere).

    2.) Weigh your sample on a balance and record the data. Look back to the first lab and find the original weight of your sample and calculate the percent of water. You can do this by subtracting the dry soil from the original weight of the wet soil and dividing that number by the wet soil. Then record what you got in your lab journal and add it to the class data sheet.

    3.) Create a non- flooded plate and saturated the soil with sterile water. There should be just enough water that when you slant the plate a small pool collects to one side rather than there being so much water the entire plate is just a pool of water.

    4.) Observe the non- flooded plate using the dissecting microscope and look to the edge of the water that has pooled together for ciliates. It is common to not see any ciliates but make sure to record all initial observations made in your lab journal and remember that excystment takes place within 24-48 hours and more ciliates maybe be seen after that time period.

    5.) Obtain a falcon tube and fill the first 3mL with the soil from your sample and then fill with water to the 8mL marker. Label this falcon tube with your initial. course number, and semester year (KSA31F17). After you have a filled falcon tube, shake it and the let it sit so that the sand, silt, and clay can settle and the soil texture can be calculated.

    6.) After the soil from the falcon tube has settled for a little bit, pipet 1mL into a micro centrifuge tube and put it in the centrifuge for one minute so that are the sold particles within the water create a pellet at the bottom of the tube.

    7.) Pipet out only the liquid carefully so none of the pellet from the bottom is obtained. Pipet the liquid into a small glass bottle.

    8.) Obtain pH paper and place a small amount of it and place it in the small glass bottle with the water from your sample. Shake the glass bottle until the pH changes color. Review the pH color wheel to determine the pH of your sample and record it in your lab journal.

    9.) Return back to your falcon tube that has been sitting and add one drop of the soil texture into the tube and shake once more. Place the tube in the green rack on the counter and let it sit until next lab, this will enable you to actually calculate the soil texture during the next lab.

    Data/Observations:

    Mass of Empty Petri Dish- 5.7g
    Mass of Petri Dish with Wet Soil- 35.5g
    Mass of Wet Soil- 29.8g
    Mass of Petri Dish and Dry Soil- 28.0g
    Mass of Dry Soil- 1.8g
    Percent of Water Content- 6.04%
    pH- 6.5

    My soil was very dry and needed a lot more water to even create the non- flooded plate compared to of individuals. The soil itself was very mulch like and had a lot of clumps, twigs, and even some small branches. The texture was very thick and it was a very dark color that resembled more of a black than a brown.

    Current Storage:

    My falcon tube is currently stored on the back lab counter within a teal- green stand with the other students falcon tubes and is label with my soil identifier, KSA31F17. The non- flooded plate is located in the same drawer it had been in which is located on the back left table on the second drawer on the front side facing the projector.

    Future Goal:

    After completing this experiment, our eventual goal will be to identify and extract ciliates from our soil sample and culture them. Following all of these procedures will also help us for any future research especially if that research is related to ciliates in any way. Using all the equipment and properly measuring things will help us create a foundation for any later laboratory research we may participate in.

    October 26

    Lab 10: Finalizing Lab Report Draft 10/26/17

    Print Friendly, PDF & Email

    Objective:

    Today, the goal of lab was to present our final figures and receive advice about how to make the best figure to put in our lab reports. After the presentations the majority of class was spent on finalizing our rough drafts. The main goal of class today was to be able to ask questions and find out how to structure these lab reports.

    Purpose:

    The purpose of today was to prepare us for our final presentation at the end of the course as well as for submitting our final revision of our lab reports. Today gave much insight into the future and how we as a students will have to perform when presenting scientific information whether that may be within a report or an oral presentation.

    Procedure:

    1. Previously have finished a draft of the lab report with most to all sections completed.
    2. Present the final draft of the group figure as well as record information from other groups which may be helpful to add it to the “Discussion” section of the report.
    3. Work with your group to make any revisions to the final figure after the presentation.
    4. Ask questions about Lab Report to ensure it is structured in the best way possible.
    5. Finalize rough draft and submit it by the end of the class period.
    6. Continue to work this draft before meeting with Felecia one on one.

    Data and Observations:

    Observing all of the other groups presentations helped my group in realizing what we ourselves needed to fix based on Dr. Adair’s comments. Our presentation was not perfect and we needed to correct moles per milliliter to micro moles per milliliter. Many students were struggling in similar ways as I am so listening in to the advice they were being given was very helpful to me when revising my own draft. There is no real quantitative data for this lab but everyone was working very hard to try and understand what they needed to do in order to finalize their drafts as well.

    Future Goal:

    After completing this rough draft, my goal is to continue to revise it and make it more presentable when I meet one on one with Felecia. I also hope to be able to write better more official lab reports in the future. Learning how to write these reports now will better help as a further my education at Baylor as well as any future research I participate in.

    October 20

    Lab 9: Creating Figures Using Excel 10/19/17

    Print Friendly, PDF & Email

    Objective:

    The goal of lab today was to learn how to correctly create a figure using excel. Student needed practice using the Excel graphs and how to manipulate them in a way that they portray all the information that is necessary in order for individuals to interpret the information presented. The main objective of today was to learn how to use Excel better and more efficiently when interpreting data.

    Purpose:

    The purpose of today’s lab was to ensure that we are prepared to write our research papers with figures that have the correct information and are formatted in the best way. This lab is very important, not only for this experiment and course but for any future participation in research. Knowing how to use Excel will help to interpret data to create even more data that could lead to a researcher knowing whether or not they are able to reject or fail to reject their null hypothesis.

    Procedure:

    1.) Open the Excel spreadsheet containing all of the class data.
    2.) Record all of the data pertaining to the students who were testing the same dilution factor as your group.
    3.) Open a new blank excel sheet and label two adjacent columns “treatment” and “control”. Then record all of the data from each trial into their corresponding columns on this new spreadsheet.
    4.) Once all of the data is recorded, take the average of each one.
    *The average is necessary in order to create a wholistic view of the data collected.
    5.) Within Excel, click “Insert” located on the top and in the drop down menu, click “recommended charts” which will give a variety of graphs that interpret in different ways. Choose the bar graph because it is the best way to interpret this data.
    6.) After selecting the bar graph, move the cursor over to the chart and click it. Then in the top right corner select “add chart element” and scroll down and select to add error bars.
    *The information that is needed for this step was calculated in the F-test as standard area for two variables.
    7.) Within the “error bars” tab, select “more options” then insert the standard error manually based on the descriptive statistics calculated from the previous lab. This process will place error bars on the two variables shown on the bar graph.
    8.) In order to change the color and style of the bar graph, double click on the bar graph and you can select “add chart element again” and from their you can add both vertical and horizontal axis titles.
    9.) Label the vertical axis “cell count of tetrahymena (cells/mL)” and then label the horizontal axis “treatments” (label the individual bars “control or water” and “insulin” according the corresponding data presented).
    10.) In the top left corner next to the “add chart element”, there is an option to select “quick layout”, if you select this option, then click the seventh layout format from the top and will automatically provide space for a title, and a space to label both axis.
    11.) To complete the figure, save the chart as an image (jpeg) and place it in a word document to add a figure caption, then save the whole document and your figure is complete.

    Data/Observations:

    Current Storage:

    During this lab and a few previous labs, we have been working in the computer lab and there are currently no trials or experiments being conducted at this time which would mean “current storage” would not be applicable while as we are writing drafts for our research papers.

    Future Goal:

    This lab will definitely help us for conducting research in the future because learning how to properly document our findings and results will ensure that others can read our reports and be able to recreate this experiment for future questions that arise regarding ciliates intake of insulin and how it affects them. Learning how to use excel will definitely ensure that we are future researchers will be proficient in not only conducting research but documenting our findings properly.

    October 12

    Lab 7: Toxicity Assay Experiment Using Insulin 10/5/17

    Print Friendly, PDF & Email

    Objective:

    Today our goal is to finally conduct our experiment by testing whether of not the concentration of insulin that tetrahymena are exposed to affects their growth or death rates. We will perform serial dilutions with a control group of water and a treatment group of insulin to conduct the experiment. Each group will be assigned a dilution factor in which each group member will test three times to maximize our trials per dilution factor in the class as a whole.

    Purpose:

    The purpose of conducting this experiment is to finally test how insulin affects tetrahymena, specifically how it affects their growth and/or death rates. The purpose of this experiment as a whole is to continue practicing serial dilutions so that in the future we will be able to conduct our own research.

    Procedure:

    1. Obtain a sterile 12 well vwr tissue culture plate, an insulin stock solution, sterile water, a tube of standard tetrahymena media, various micropipettes and their corresponding tips, as well as concavity slides.

    2. Assign three wells to be the control group and three wells to be the treatment group. There are three wells of each to test the designated solution factor three times for both water and insulin.

    3. Use a P1000 micropipette to take out 990 μl of the tetrahymena media solution and add it to all six wells that will be used for this experiment.

    4. Use a P20 or a P10 micropipette to take out 10 μl of sterile water and add it to each well of the control group (using a total of 30 μl of water).

    5. Use a P20 or a P10 micropipette to take out 10 μl of the insulin stock solution and add it to each well of the treatment group (using a total of 30 μl of the insulin stock solution).

    6. To ensure the samples are mixed thoroughly, it is possible that they may need to be stirred using a micropipette tip.

    7. Using 990 μl the tetrahymena media with either 10 μl of water of 10 μl of insulin creates a 1:10 dilution factor.

    8. View a 10 μl drop from each well and count how many ciliates are visible and record your observations.

    9. After 24 hours (open lab) view another 10 μl drop from each well sample and count how many ciliates are visible and record your observations.

    10. Since you used a 10 μl sample, you must the number of dilates counted by ten, then you would multiply the amount of ciliates by 1000 to account for the 1:10 dilution factor, and this will tell you how many ciliates were present in each well sample (approximately).

    11. Compare data from the initial number of ciliates counted for each sample to the number of ciliates counted after 24 hours.

    Data and Observations:

    After comparing the number of ciliates counted between the two samples, I know that the insulin has had to have made the tetrahymena able to produce faster as they absorb more nutrients. I think that the 1:10 dilution factor was a good amount because it did not seem like too much because they did not die within 24 hours. They thrived more in the insulin than in the control group containing water.

    Current Storage Situation:

    The well plates were labeled and place in the bottom middle drawer on the front side of the desk, facing the projector, containing member of groups C and D. Mine is personally in the far bottom left corner within the drawer nearest to walls of the drawer. It is labeled KSA31F17.

    Future Goal:

    After the experiment is finished I hope to be able to use my data and apply statistical analytic programs used in Excel in order calculate things such as standard deviation, mean, and t-Tests as well as F-Tests. I hope to gain further knowledge of how to successfully use this software so that I can apply it to any researchI conduct in the future.