Jess Hastings
Date of Work: 2/27/2017
Rationale: The purpose of the lab was to annotate the full genome of Timinator by having each student annotate 5 genes individually. This process would allow us to annotate a whole genome in one class and provide more practice with annotating.
Tools Used: DNAMaster, DNAMaster Quick Start Guide, NCBI Website, Phagesdb Website, Phamerator, Staterator, HHPred
Methods:
- Run an Auto-Annotation of Timinator_Draft in DNAMaster
- For each gene in the region, check and, if needed, change the following parts of the annotation:
- SSC: call start of the gene
- CP: coding potential found on GeneMark (on phagesdb)
- SD: score, if it is the best score and if not why, z-score
- SCS: does it agree with Glimmer and GeneMark
- Gap: calculated from start/stop location
- NCBI Blast: protein product on NCBI
- Phagesbd BLAST: protein product on Phagesbd
- HHPred: best hit with e value or no good hit
- LO: longest open reading frame
- ST: does it agree with Starterator
- F: function
- FS: evidence that supports function decision
- Fill each part of the annotation into the Timinator Google document
- Change status on the home page to completed
Conclusions:
The genes in Timinator that I annotated were: Gene 6, Gene 28, Gene 50, Gene 72, & Gene 78. Following is the result and eveidence for each annotation.
Gene 6:

Figure 1: Gene 6
The following annotation is my results for gene 6:
Start: 5593bp Stop: 5829bp BKWD GAP: 127bp Gap SD Final Value: SD Score: -3.523 (best score) Z-Value: 2.642 CP: The gene is covered SCS: Agrees with Glimmer, Agrees with GeneMark NCBI BLAST: hypothetical protien BARRETLEMON_6 [Arthrobacter Page Barret Lemon] q1:s1 E-Value: 1e-47 CDD: No good hit PhagesDB BLAST: Function Unknown [Sonny_6], evalue: 5e-31 q1:s1 E-Value: 5e-31 HHPred: No Good Hit LO: No, Blast q1:s1, Agrees with GeneMark and Glimmer ST: Agrees with Starterator F: NKF FS: NCBI, Phagesbd Notes:
Gene 6, followed the auto annotation. There was not start changes that needed to be made because the call that was made in the auto annotation agreed with Starterator, the GeneMark coding potential, and produced a q:1:s:1 score on the NCBI Blast. Even though this was not the longest ORF, I did not change the start becuase of the q1:s score and becasue this is a reverse gene, so there needed to be a gap for the promoters.
Evidence for gene 6:

Figure 2: Gene 6 Coding Potential from GeneMark

Figure 3: NCBI Blast results for Gene 6

Figure 4: Phagesbd Blast results for Gene 6

Figure 5: HHPred results for Gene 6; no good hit
Gene 28:

Figure 6: Gene 28
Start: 23729bp Stop: 25318bp FWD GAP: 11bp Overlap SD Final Value: SD Score: -2.578 (2nd best score) longest ORF Z-Value: 3.143 CP: The gene is covered SCS: Agrees with Glimmer, Agrees with GeneMark NCBI BLAST: endolysin [Arthrobacter Phage BarretLemon] q1:s1 E-Value: 0 CDD: PGRP Superfamily E-Value: 1.18e-7 PhagesDB BLAST: endolysin [BarretLemon 28] q1:s1 E-Value: 0 HHPred: lysin E-Value: 1.4e-23 LO: Yes ST: Agrees with Starterator F: endolysin, LysM-like FS: HHPred, NCBI, Phagesbd Notes:
Gene 28 also followed the auto annotation given by DNA Master. This gene was forward, and although the call is the 2nd best SD score, it is the longest ORF. Gene 28 has the function endolysin, and was part of the PGRP Superfamily.
Evidence for Gene 28:

Figure 7: Gene 28 Conserved Domain Results from NCBI

Figure 8: Gene 28 Coding Potential from GeneMark


Figure 9: Gene 28 NCBI Results

Figure 10: Gene 28 HHPred Hit
Gene 50:

Figure 11: Gene 50
Start: 37229bp Stop: 37447bp FWD GAP: 4bp Overlap SD Final Value: SD Score: -5.179 (Best score) Z-Value: 1.848 CP: The gene is covered SCS: Agrees with Glimmer, Agrees with GeneMark NCBI BLAST: Hypothetical Protien Barretlemon 50 [Arthrobacter phage Barret Lemon] q1:s1 E-Value: 5e-43 CDD: No good hit PhagesDB BLAST: [BarretLemon 50] E-Value: 4e-35 HHPred: No good hit LO: Yes ST: Agrees with Starterator F: NKF FS: NCBI, PhagesDB Notes:
Gene 50 followed the auto annotation given by DNA Master. This gene was forward and the call was the best SD score, longest ORF, and agreed with Starterator. Because of these reasons, I made no change. No function was found for Gene 50.
Evidence for Gene 50:

Figure 12: Gene 50 Coding Potential from GeneMark

Figure 13: Gene 50 Phagesbd Blast Results

Figure 14: Gene 50 NCBI Results

Figure 15: Gene 50 HHPred Hit; no good hit
Gene 72:

Figure 16: Gene 72
Start: 45650bp Stop: 46270bp FWD GAP: 4bp Overlap SD Final Value: SD Score: -6.6022 (6th best score) Longest ORF Z-Value: 1.283 CP: The gene is covered SCS: Agrees with Glimmer, Agrees with GeneMark NCBI BLAST: AlpA-like DNA binding protein [Arthrobacter phage BarretLemon], q:1, s:1, E-Value: 9e-75 CDD: No good hit PhagesDB BLAST: AlpA-like DNA binding [BarretLemon_72] E-Value: 9e-59 HHPred: TORI inhibition Protien – DNA binding protien E-Value: 1.7e-11 LO: No, was not best score ST: Agrees with Starterator F: dsDNA break-binding protein, AddA- like FS: Phagesbd, NCBI, Hhpred Notes:
Gene 72 followed the auto annoation produced by DNAMaster and was found to have a function of dsDNA break-Binding Protein. This call was not the longest ORF because it was not the best SD score. Additionally, this call had a q1:s1. There needs to be a gap for the promoters.
Evidence for Gene 72:

Figure 17: Gene 72 Coding Potential from GeneMark

Figure 18: Gene 72 Phagesbd Results


Figure 19: Gene 72 NCBI Results

Figure 20: Gene 72 HHPred Hit
Gene 7B:
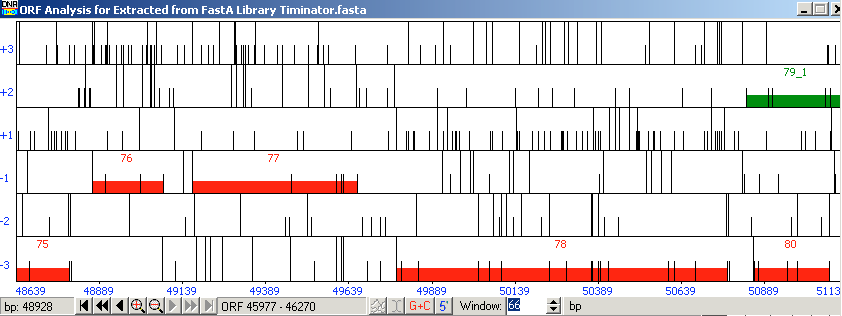
Figure 21: Gene 7B
Start: 50785bp Stop: 49781bp BKWD GAP: 50bp Gap SD Final Value: SD Score: -4.79 (2nd best score) longest orf, q1:s1 Z-Value: 2.051 CP: The gene is covered SCS: Disagrees with Glimmer, Agrees with GeneMark NCBI BLAST: Hypothetical Protien [Arthrobacter phage BarretLemon 78] q1:s1 E-Value: 0 CDD: DUF932 SuperFamily E-Value: 1.39e-52 PhagesDB BLAST: Hypothetical Protien [BarretLemon 78] q1:s1 E-Value: 0 HHPred: No good hit LO: Yes ST: longest orf, q1:s1 F: NKF FS: NCBI, Phagesdb Notes:
Gene 78 did not follow the auto annotation given by DNA Master. In the auto-annotation, gene 80 was removed because it overlapped with gene one and gene 79. After this shift, I chose to extend gene 78 and move the start call. I made this decision based on the q1:s1 score recieved in BLAST. I found, when BLASTing the auto annotation, a score of q1:s3. By extending the gene, it was the longest ORF and the 2nd best SD score. This call still has a big enough gap for the promoters because it is a reverse gene.
Evidence for Gene 78:

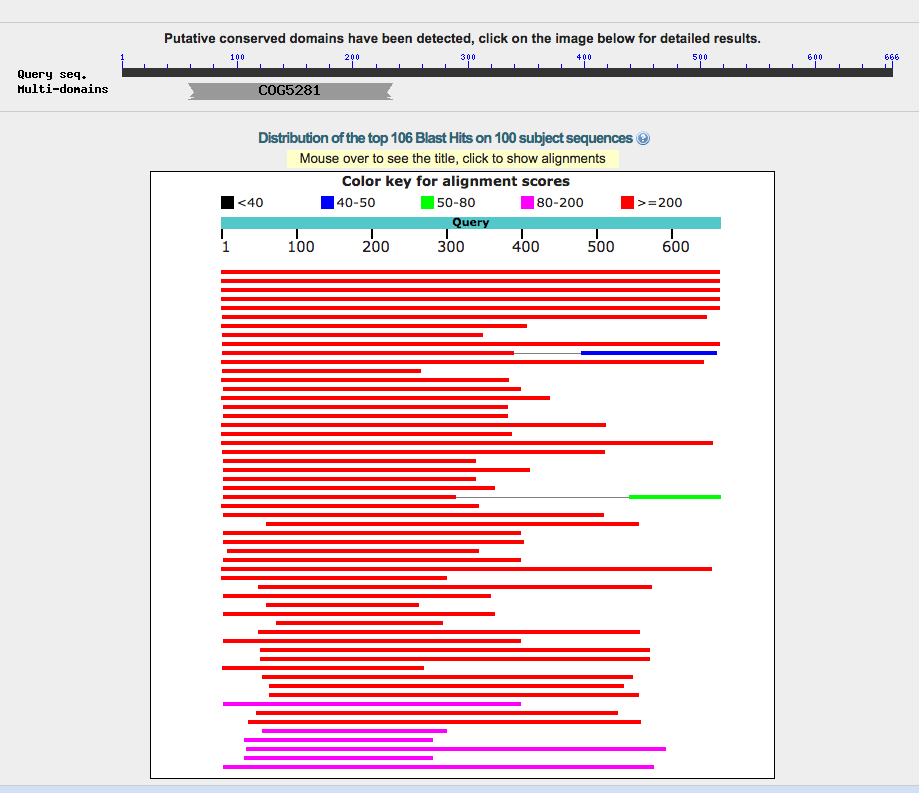
Figure 22: Gene 78 Conserved Domain Results from NCBI

Figure 23: Gene 78 Coding Potential from GeneMark

Figure 24: Gene 78 NCBI Results

Figure 25: Gene 78 HHPred Hit; no good hit
Conclusion:
After annotating all 5 of these genes, I feel mostly comfortable with the annotation practices. The part I am least confident on is annotating reverse genes. I was able to annotate all 5 of these genes within the 2.5 hours of lab time.
Future Plans:
Next week in lab we will double check our annotations of Timinator, and once they are complete then we can begin the process of preparing Timinator to be submitted.