Node XL is template for Excel. Available in both a paid and free version. It allows you to pull data from Twitter, Facebook, YouTube, emails, and more and visualize the resulting network.
Pre-steps: If you don’t have a Twitter account, make one. If usually use a Mac, go find a PC (Node XL only works with the Windows version of Excel).
1. Go to the NodeXL website and download the program. (If you’re using the PC in the Baylor Digital Scholarship Space, you can skip this step, it’s already downloaded)
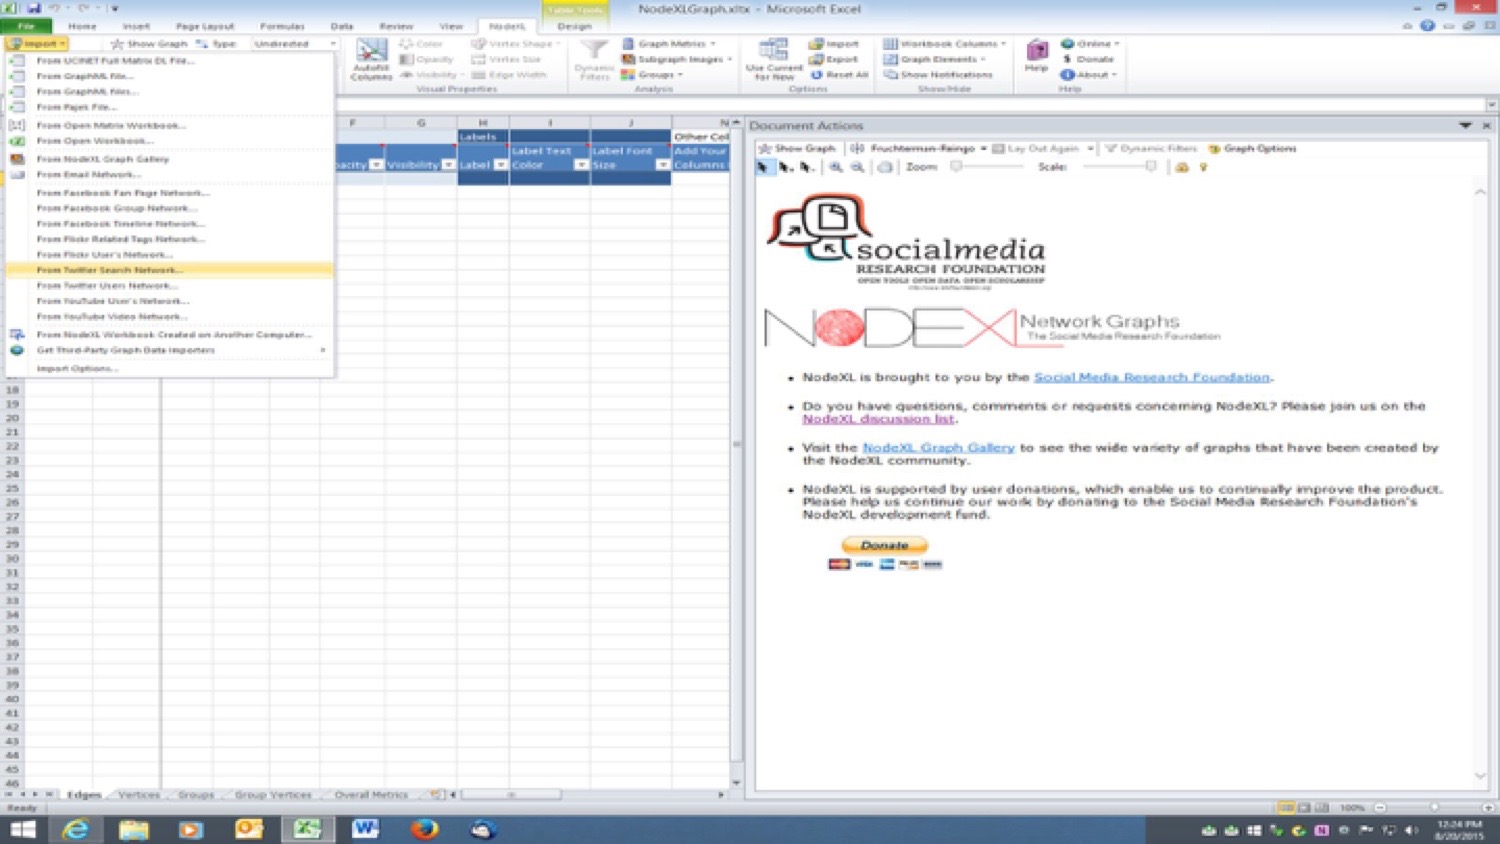
2. Open up NodeXL, you’ll see this screen or something similar (it varies depending on the version of Excel you’re running) 
3. Click on the NodeXL tab, then Import, and then From Twitter Search Network
4. Fill in what word or phrase you’d like to search. You can use hashtags or keywords. Decided how many tweets you want to pull (the free version limit is 2,000). Decide if you want to pull just the people tweeting about your search term, or those people plus their friends. Click ok.

2. Authorize NodeXL to use your Twitter account.
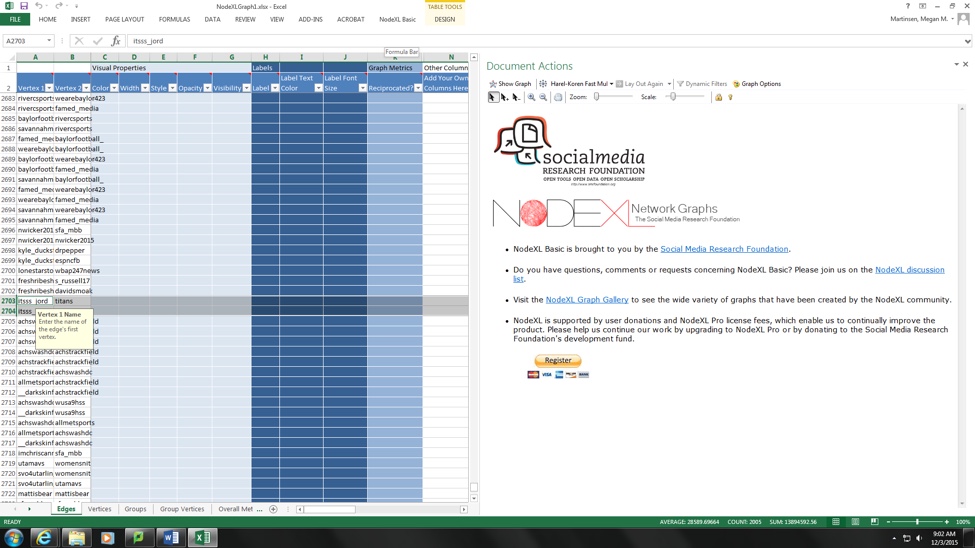
3. Node XL will then start collecting information from Twitter. This could take a while. When it’s done all the information will populate into a spreadsheet. On the right portion of the screen under Document Actions, click Show Graph
4. Node XL will automatically generate the network graph without group separations.
5. To separate the nodes of the graphs into groups, click on the Node XL basic tab, then click groups and then select which type of grouping you want to use.

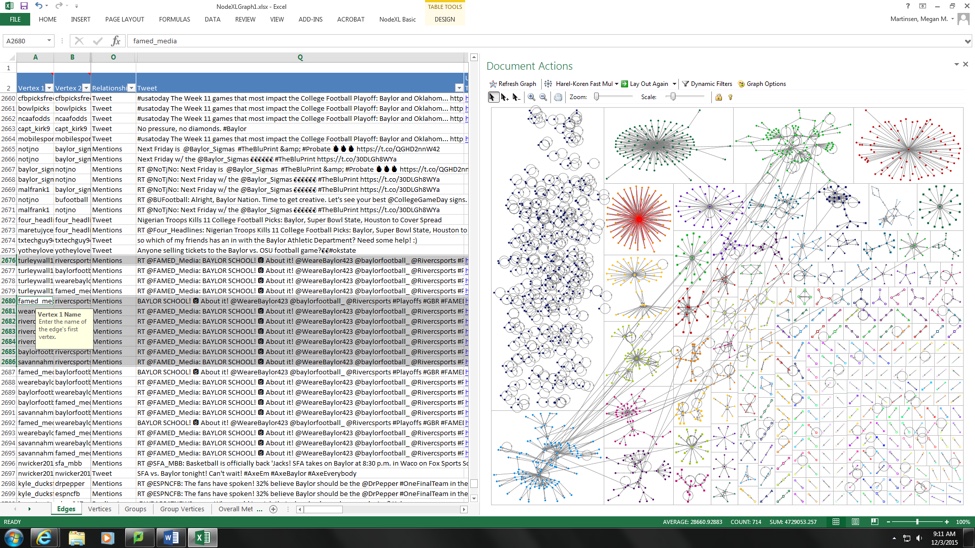
6. Node XL will then divide the nodes into groups and color code them.
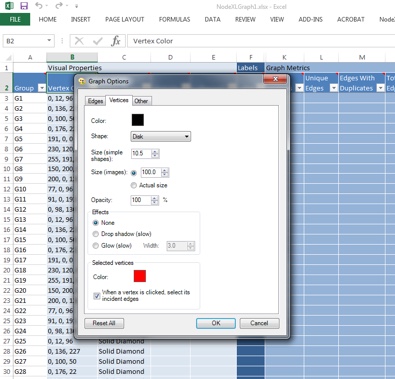
7. To adjust the look of the nodes and edges click on Graph Options under Document Actions. And change the settings to your liking.
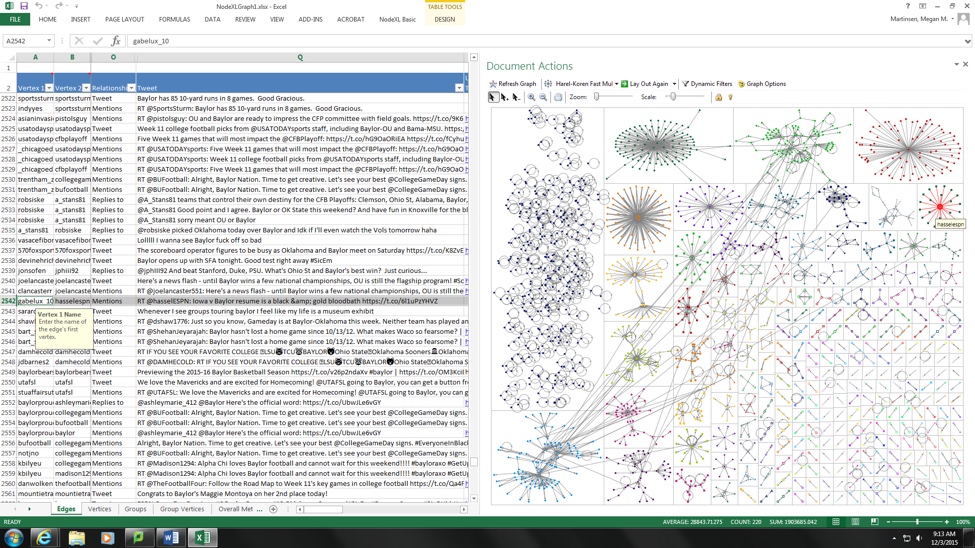
8. Now you’re ready to explore your network graph. Tweets highlighted in the spreadsheet will also highlight on the graph and vice versa.
9. If you want to filter the nodes or edges in the graph you can do this by clicking the NodeXL Basic tab and then clicking dynamic filters.

10. If you want to save your graph as an image, right click on the graph and select Save Image to File and the Save Image.


