May 2

FINAL NOTEBOOK CHECK

Date: May 1, 2017

Classifying Ciliates using DNA Extraction

FIGURE 1:

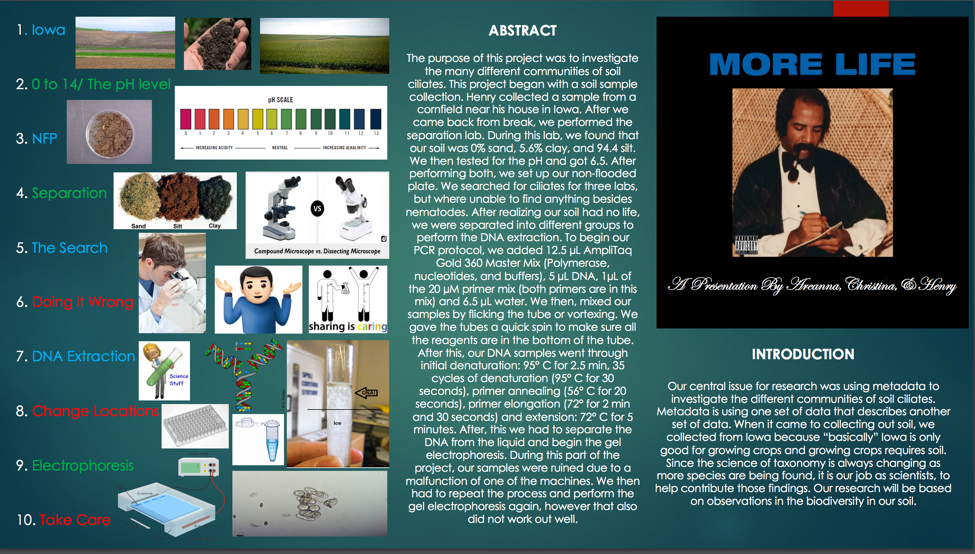
In Figure 1 we have our final poster project. This summarizes what we have been doing over the past few weeks, while classifying ciliates.

Procedures:

Soil and Metadata collection:

  1. Collected a soil sample from Iowa in a corn field because Iowa has rich soil.
  2. Record information about our soil such as, location (GPS), date, time of day, temperature, last rainfall, humidity, color, etc..
    • Location/Climate
      • Iowan Cornfield
      • Latitude: 41.470282
      • Longitude: -95.318582
      • Date: March 11, 2017
      • Time: 6:30 pm
      • Temperature: 29 degrees F
      • Humidity: 65%
      • Last Rainfall: 1 month prior
      • Color: Brown
  3.  Then transferred 5 g of the sample into a weighing boat, and weighed the new sample.
    1. Wait 1 week and weigh the boat again.
    2. Calculate the percent composition of the sand, silt, and clay.
      1. % Sand –> 0%
      2. % Clay –> 5.41%
      3. % Silt –> 94.59%
    3. Obtain the pH of the dirt with pH paper
      1. Ours was pH was 6.5 = acidic
  4. Added soil to 5mL mark of the falcon tube and added water until the 10mL mark. Then I vortexed the mixture.
    1. This is to help find what type of soil it is.
  5. After a week, the falcon tube divided the mixture into layers.
    1. Measure the layers using a ruler and do some calculations to get a percent composition.
    2. Our dirt was mainly silt.
  6. Next I took the soil sample and placed it into a non-flooded dish, and put just enough water to where there is some runoff, but didn’t flooding it. Then observed under a microscope.
    1. After three days of searching, I found no sign of ciliate life.

DNA Extraction:

  1. I borrowed my new sample from the infamous Lily because she knew how to raise her ciliates.
    1. Her % composition was:
      • Sand–>92%
      • Silt–>0.4%
      • Clay–>8%
  2. Transfered 400uL of her cultured ciliates into a centrifuge tube.
  3. Centrifuged the tube for 5 minutes at 6000g.
  4. I Added 200uL of Chelex into the tube and vortexed for 1 minute
  5. Incubate at 56 degrees C for 8 minutes
  6. Then place the tube in a 100 degrees C water bath for 8 minutes.
  7. Centrifuge at 16000g for 3 minutes.
  8. Transfer the supernatant into another centrifuge tube and label with the Soil identifier
    1. HHN0617
  9. Then to determine the purity of the sample, a nanodrop spectrometer was used.

PCR:

  1. 12.5 uL 2x Master Mis, 5uL DNA, 1uL of uM primer and water was added to form a PCR mixture.
    • It was added to the 25uL volume mark.
  2. The control tube didn’t have DNA but had more water, while the experimental tube had the more DNA
    1. Label the control tube 6OC and the experimental tube 6O.
  3. Both of the tubes were vortexed for 10 seconds and stored until the lab was over.

Gel Electrophoresis:

  1. We added 100 ml of 1XTAE and 1.5 g of argose to a 250 mL flask and microwaved.
  2. We assembled the tray by placing the comb into the tray with the two bumpers on each side.
  3. We filled the tray with gel about halfway up the combs.
  4. Thermocycling procedure:
    1. Denaturation at 95 degrees C for 30s
    2. 35 cycles:
      1. Denaturation at 95 degrees C for 30s
      2. Annealing at 56 degrees for 20 s
      3. Elongation at 72 degrees C for 2:30s
    3. Extension at 72 degrees C for 5 minutes
  5. Added 5 ul of the ladder to the product using a micropipet into the gel tray.
  6. We then placed the lid on the tray after loading the DNA samples into their respected loading zones, and turned it on at 100 volts for 30 minutes
  7. We placed the tray under UV light so we could actually see the results.

Here is a visual representation of our Gel Electrophoresis:

Labeling Info:

  • Soil Identifier: HHN0617
  • PCR Label: 6O

Ideas for Future Experiments:

  • Make sure to double check your work, even if you think you did it right the first time.
  • Don’t be afraid to question the results or the process
  • Use more than one sample
May 1

LAB 14: Gel Electrophoresis & Posters

Date: April 20, 2017

Objective:

The objective of this lab was for us to understand the process of Gel Electrophoresis and for us to continue our poster designs.

Background:

In the last lab we completed PCR (Polymerase Chain Reaction) which leads us into Gel Electophoresis.

Procedures:

  • We had to repeat our PCR due to some technical difficulties, so follow the procedures form the last lab notebook.

Loading the Gels

  • Using DNA from the last lab that was contaminated, we practiced loading the wells for Gel Electrophoriesis.
    • Extract 10 uL DNA with pipette and with a steady hand carefully load the DNA into the gel wells.
    • Watch as the gel box  sent volts of electricity through the gel. This shows us the size of the DNA we are observing.

Posters

  • Traveled to the computer lab for us to start on the process of our poster designs.
  • We collaborated with each other on where we wanted to start, then met up outside of lab to finish the poster.

Observations/Results: 

We got to watch electric currents shoot through our Gel, so we could see the different DNA sizes.

Ideas for Future Experiments:

Come prepared to the last lab, which is our final presentations.


May 1

LAB 13: PCR

Date: April 13, 2017

Objective:

The objective for this lab was for us to know what PCR is and how to preform it.

Background:

We just finished our DNA Extraction in the last lab, which is transitions us into the PCR which stands for Polymerase Chain Reaction.

Procedures:

  • Label the two centrifuge tubes. One of them will be a control group and the other is the treated group
    • 6O and 6OC
  • Place 5 uL of the 10 micrometer of the ciliates DNA into TAQ mix
    • 12.5 uL for the treated group.
  • Put 1.0 uL of the 10 micrometer primers into both the controlled and treated tubes.
  • Add 6.5 uL of water to the treated group and 11.5 uL of water to the controlled group.
    • Total volume = 25 uL
  • Mix the two samples thoroughly
    •  Vortex
  • Thermal Cycling:
    • Initial denaturation at 94 degrees  C for 2.5 seconds.
    • 35 cycles
      • Denaturation 94 degrees C for 30 seconds
      • Primer annealing 56 degrees C for 20 seconds
      • Primer elongation 72 degrees C for 2.5 minutes.
    • Extension –> 72 degrees C for 5 min.
    • Stay at 4 degrees C

Observations:

  • Started off with a frozen tube, which needed to thaw at room temperature or by using our hands to warm it up in order to perform PCR.
  • The controlled group didn’t have DNA, whereas the treated group contained DNA.

Ideas for Future Experiments:

  • Don’t lag  behind the group, because you will get lost and have to ask millions of questions for clarification.
  • Remember what you labeled your tube for easy location.


May 1

LAB 12: DNA Extraction

Date: April 6, 2017

Objectives:

The objective of this lab was to learn the process of DNA extraction and be able to preform this ourselves.

Background: 

So far, we have been observing out soil samples for ciliates, and once we found said ciliates, we would culture them for further research. We isolated these ciliates and are now about to extract their DNA.

Procedure:

  • Transfer 500 uL of ciliate culture into a microcentrifuge tube
    • Labeled HHN0617
  • Centrifuge at 6.000g for 5 minutes and get rid of the supernatant that is at the top of the centrifuge tube.
    • Carefully using a micropipette tip to suck out the supernatant, be sure not to grab the sample at the bottom.
  • Add 200 uL 5% Chelex pellet; vortex for 1 minute.
  • Incubate for 30 minutes at 56 degrees C in a water bath
    • This will break open the cells and denature proteins.
  • Boil for 8 minutes at 100 degrees C in water bath.
  • Vortex for another minute.
  • Centrifuge at 16,000 g for 3 minutes to pellet cellular debris and chelex beads.
  • Transfer the supernatant with DNA to another microcentrifuge tube and label.
    • Don’t transfer the Chelex beads

Observations/Results:

The Nanodrop results were 40.75 ng/uL and the ration was 1.35

  • Ratios that are <1.8 mean there is a protein contamination.
    • The results I got show there is a protein contamination.

Ideas for Future Experiments: 

Clearly identify my micro centrifuge tubes would help any confusion during this experiment. Not rushing through the process, helps you really understand what the purpose is.

May 1

LAB 11: Characterizing Ciliates

Date: March 30, 2017

Objectives:

The objective of this lab was for us to be able to classify ciliates, know about the diversity among ciliates, culture our ciliates, and continue ideas for our final poster.

Background:

In the previous labs, we have been observing the ciliates in our soil, if we had any, and we have been culturing the ciliates we have found.

Procedures:

  • Record out soil metadata on the Spreadsheet
  • Observe our non-flooded plates under a microscope after a week of sitting in the incubator
    • Determine if there were any changes in you soil sample from last week.
  • If ciliates are found observe them closer under a compound microscope.
  • If none are found, continue to observe the non-flooded plate until you find one, or until all hope is lost.

Observations/Results:

  • Once again, there were no ciliates to be found in my sample.
  • I gave up, and used Lilly’s sample, because she had a butt ton in her soil.
  • Capturing her ciliates was difficult, because they were incredibly small and quick.
  • Once I captured the ciliate, I placed it in a tube
    • Labeled : HHN0617

Ideas for Future Experiments: 

  • Again have better soil, so I don’t have to spend 3 whole labs searching. (Luckily Lilly was the ciliate whisperer and had tons.)
May 1

LAB 10 Soil & Ciliates

Date: March 23, 2017

Objectives: 

Our objective was to learn how to properly pick and culture ciliates and be able to observe them under microscopes. Another objective was to be able to separate sand, clay and silt of the soil and determine the percentages of each in a sample.

Background:

Last week we collected soil samples from various regions, and we observed these sample to see what was actually in our soil. We wanted to look at what ciliates were hiding inside of our soil.

Procedures: 

Soil Metadata: Percent Sand, Silt and Clay

  • Using a metric ruler measure the heights of the sand, silt and clay of our samples.
  • Calculate the percentages of all three.
    • Sand –> 0%
    • Clay –> 5.41%
    • Silt –> 94.59%
  • Identify the soil you have based on the percentages you got. The soil we had was mainly silt, so it was silt.

Soil pH

  • Grab pH paper and extract soil from the non-flooded plate and observe the change in pH
    • pH of our soil was 6.5 which is acidic almost neutral.

Culture and Characterize ciliates

  • While looking at ciliates in our non-flooded plate under a microscope, we isolated a ciliate and tried to culture it.
    • If obtained a cilate place on a concavity slide to further your observations.
  • Add 1.5 mL Cerophyll in a well plate with that one ciliate.
  • Place in an incubator for storage to help preserve the samples.

Observations/Results:

  • There was no signs of ciliates in our non-flooded well plate.
    • There were only nematodes.

Ideas for Future Experiments:

  • Pick better soil for more results.


April 13

LAB 9: Collection of Soil

Date: March 16, 2017

Learning Objectives:

  • In this we will continue to learn how to set up a non-flooded plate
  • Take samples of soil from various locations during Spring Break (Mine –> Iowa)
    • Be able to describe the % of sand, silt, and clay in your collection
  • How to culture and observe soil ciliates.

Background:

In the previous labs, we have been observing different samples of soils, so now we are using the soil from a different location to see the if there are any differences in the ciliates compared to the previous observations.

Procedure:

Soil Metadata –> The soil collected was from the GREAT state of Iowa.

  • Weigh a weigh boat = 2.2g
  • Add ~5.0 grams soil to the weigh boat
    • Ours was 5.2 grams.
    • Total weight = 7.4 grams
  • Place the soil sample in a petri dish
    • Saturate the soil, but don’t flood the sample.
    • Observe under a dissecting microscope.

Falcon Tube Protocol 

  • Label the tube (HHN06S17)
  • Add 5mL of soil to the falcon tube
  • Fill the tube to 10mL with distilled water
  • Add 1 drop of resuspension solution
    • Mix using the vortex
  • Let sit to allow the solution to separate.
  • Observe more from the from the petri dish
  • Separate the top liquid layer.

Results/Data:

Observations:

  • Not much movement
  •  1 ciliate found
    • Color: Clear
  • Swimming too quickly to possibly see.

Ideas for Future Experiments:

  • Try not to over-saturate the soil
  • Don’t give up looking at the soil, even when you don’t find anything the first few times around.
  • Check after a period of time, to check for life.
April 13

LAB 8 Peer Review & Soil Ciliates

Date: March 2, 2017

Learning Objectives:

  • In this lab we set out to learn more about the scientific thinking for our Lab Reports, while being able to peer review another paper, and use the critiques on our papers to better them.
  • We are also going to observe soil Ciliates in non-flooded plates.

Background:

  • In past labs, we have been observing the different ciliates under microscopes, so this is nothing new. Now we are looking a little deeper to determine the ciliate classification.

Procedure:

Lab Reports

  • Review another students lab report that had a different concentration than yours, so that we can see the different results. (.0025%)
    • Give positive feedback and make sure that you aren’t just telling them what to do, but suggesting either a better way or a more efficient solution.

Soil Ciliates

  • Add 10-50 g of your soil into a petri dish
  • Add distilled water to saturate the dish, but don’t flood the petri dish.
  • Observe the petri dish with soil sample under a dissecting microscope and record your observations.
  • Transfer 100 microliters of the liquid soil sample using the 20-200 micropipette to a small watch class to observe under a compound microscope.
  • Observe and record your observations.

Results/Data:

For our peer review, we received our Lab Reports back and make corrections as needed.

For our soil ciliates, we could not find any living ciliates in the soil we observed after a few trial, all we found were dead ciliates.


Ideas for Future Experiments:

For the reports, we should make sure that the rough draft is complete, so that it helps not only you as the writer, but the reviewer be able to make full corrections.

For the soil ciliates, to not over saturate our samples.

February 26

Lab 7 – Data Analysis

February 26, 2017

Lab 7 – Data Analysis

Learning Objective:

For this lab our objectives were to, compile the results of every partner in our group and present them to the class, be able to understand the criticism and use that to our advantage, and use that criticism to better our graphs and charts.

Background:

From the previous labs we have been collecting hard counts of the number of cells in a certain sample of a controlled group and a treatment group of tetrahymena. The treatment group was treated with a pesticide called gamma cyhaylothrin.  We are going to use our data and results to create a graph of our numbers.

Procedure:

  • Collect each partners counts, average those counts, and place them into a graph using Excel.
  • Present the graphs to the class, and receive feedback from the professor and teacher assistance’s.

Data:

Ideas for Future Experiments:

Using the comments and feedback we got from class will really help us make adjustments to our graph, so that we are able to present them in a way that is more efficient for everyone.


February 26

Lab 6 – Cell Counting and Pesticide treatment Part II

February 26, 2017

Lab 6 – Cell Counting and Pesticide Treatment Part II

Learning Objectives:

The learning objectives for this lab are to continue to learn how to count cells, review the percent calculations from the data we collect, and use the results from the data to help us write our conclusion portion of our scientific report.

Background:

We have been counting certain samples of cells for a controlled group and a treated group. Last lab we counted the number of tetrahymena treated with a pesticide after waiting 24 hours.

Procedures:

  • Stir the well-plate
  • Take 2 uL of the 1 week samples of controlled and treated group and place them on a concavity slide to count and observe.
  • Make 2 counts for each well.
  • To Dilute the substance because there are too many to count, or because the sample was moving to quick, these are the steps:
    • Take 45.0 uL of PPT and place it in a plastic plate.
    • Take 5.0 uL of either the controlled or treatment group and mix the two solutions together
    • Take 2.0 uL of this new sample and place it on a concavity slide to count and observe
      • Multiply the number of cells you counted by the dilution factor.

Observations/Raw Experiment Data:

  • Controlled group after 1 week:
    • C4 – 10 cells per 2 uL
    • C5 – 11 cells per 2 uL
    • C6 – 36 cells per 2 uL
  • Treatment group after 1 week
    • D4 – 36 cells per 2 uL
    • D5 – 56 cells per 2 uL
    • D6 – 147 cells per 2 uL

As we can see here compared to lab 5 the number of cells per group significantly decreased over time. There was no affect that the pesticide had on the treatment group because both of the numbers from the data, both decreased but the treated group still had more cells in their samples.

Ideas for Future Experiments:

For tests/experiments in the future, we must be sure there is no error when transferring our samples, or when mixing our solutions.

The next part of this experiment is to take our data and be able to represent our data in graphs.