• Home
  • Data Scholar Workshops
    • Virtual Workshops
    • Guides
  • Data Viz of the Week
  • Data Research Fellows
    • About the Fellowship
    • 2020 Fellows Documentary
    • 2019 Fellows
    • 2018 DRIVE Scholars
    • 2016 Digital Scholars
  • Projects & Tools
    • Projects
      • Text
      • Data Viz
      • Geospatial
    • Tools
      • Text
      • Data Viz
      • Geospatial
  • Baylor Library
  • Contact
    • Josh Been, Director of Data Digital Scholarship
    • Josh Been Github
    • Christina Chan-Park, Science Data Librarian

Examples: Data Visualization

Mapping the Attention of Waco-Area Residents From 1916-1918

joshua_been April 18, 2021 Examples: Data Visualization, Examples: Text Mining/Analysis No Comments
Mapping the Attention of Waco-Area Residents From 1916-1918

“Mapping the Geographic Attention of Waco-Area Residents from 1916-1918” Presentation as part of the Texas Map Society Spring 2021 Meeting To understand which parts of the world attracted the attention of Waco-area residents leading up to the U.S. involvement in

Read more

Creations: Celebrating Transformational Research & Scholarship

joshua_been April 15, 2021 Examples: Data Visualization No Comments
Creations: Celebrating Transformational Research & Scholarship

Creations: Celebrating Transformational Research & Scholarship View Power BI Dashboard & Message from President Linda Livingstone Dashboard contains Creations content from 2018-2020 Our annual Creations exhibition supports the research ambitions articulated in Baylor’s academic strategic plan, Illuminate, and celebrates the

Read more

Data Viz of the Week #15: Baylor Biblical Art

joshua_been December 6, 2020 DVotW, Examples: Data Visualization No Comments
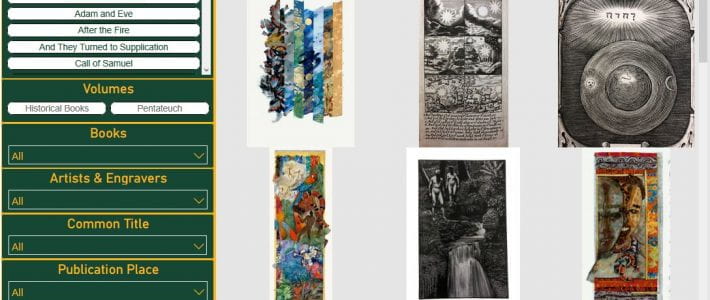
Data Viz of the Week #15: Baylor Biblical Art

Click to Launch DVotW (Data Viz of the Week) #15 Published: Sunday, December 06, 2020 Title: Baylor Biblical Art Contributors: Beth Farwell, Joshua Been Data: St. John’s Bible Data Visualization Software: Microsoft Power BI

Read more

Data Viz of the Week #14: Baylor University COVID-19 Dashboard

joshua_been November 25, 2020 DVotW, Examples: Data Visualization No Comments
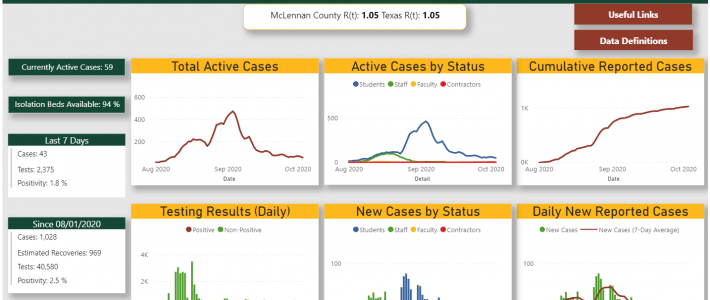
Data Viz of the Week #14: Baylor University COVID-19 Dashboard

Click to Launch DVotW (Data Viz of the Week) #14 Published: Wednesday, November 25, 2020 Title: Baylor University COVID-19 Dashboard Contributors: Joshua Been Data: Baylor University Data Visualization Software: Microsoft Power BI

Read more

Data Viz of the Week #13: World’s 100 Tallest Buildings

joshua_been November 15, 2020 DVotW, Examples: Data Visualization No Comments
Data Viz of the Week #13: World’s 100 Tallest Buildings

Click to Launch DVotW (Data Viz of the Week) #13 Published: Monday, November 15, 2020 Title: World’s 100 Tallest Buildings Contributors: Ken Carriveau, Joshua Been Data: The Skyscraper Center Data Visualization Software: Microsoft Power BI

Read more

Data Viz of the Week #12: Top 15 Bachelor’s Degree Categories Awarded by Baylor University 2012-2017

joshua_been November 9, 2020November 10, 2020 DVotW, Examples: Data Visualization No Comments
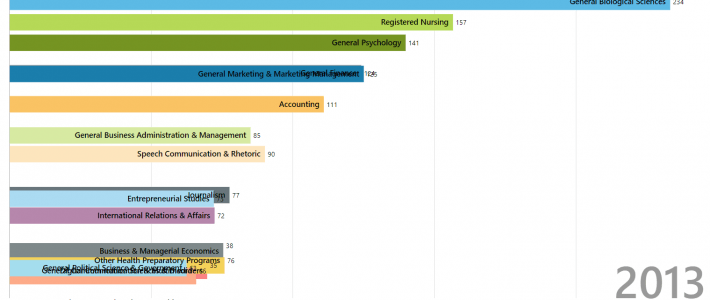
Data Viz of the Week #12: Top 15 Bachelor’s Degree Categories Awarded by Baylor University 2012-2017

Click to Launch DVotW (Data Viz of the Week) #12 Published: Monday, November 09, 2020 Title: Top 15 Bachelor’s Degree Categories Awarded by Baylor University 2012-2017 Contributors: Ellen Filgo, Joshua Been Data: IPEDS (Integrated Postsecondary Education Data System)

Read more

Data Viz of the Week #11: Early Voting by County by Date 2020

joshua_been November 1, 2020November 10, 2020 DVotW, Examples: Data Visualization No Comments
Data Viz of the Week #11: Early Voting by County by Date 2020

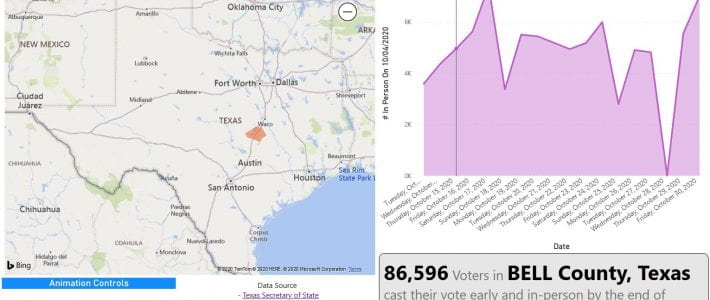
Click to Launch DVotW (Data Viz of the Week) #11 Published: Monday, November 02, 2020 Title: Early Voting by County by Date 2020 Contributors: Joshua Been Data: Texas Secretary of State

Read more

Data Viz of the Week #10: What are the Favorite Halloween Candies in Your State?

joshua_been November 1, 2020November 10, 2020 DVotW, Examples: Data Visualization No Comments
Data Viz of the Week #10: What are the Favorite Halloween Candies in Your State?

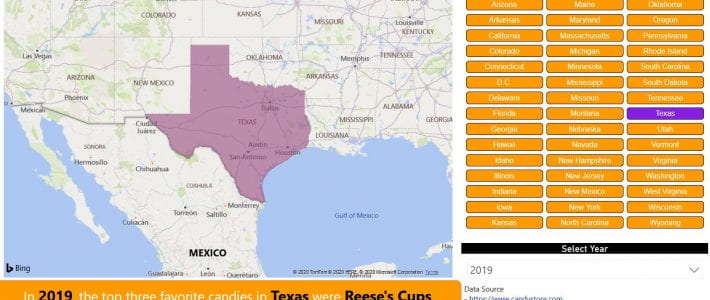
Click to Launch DVotW (Data Viz of the Week) #10 Published: Sunday, November 01, 2020 Title: What are the Favorite Halloween Candies in Your State? Contributors: Carol Schuetz, Joshua Been Data: https://www.candystore.com/

Read more

Data Viz of the Week #9: Analyzing the Use of ‘Anti-Lynching’ using HTRC+Bookworm

joshua_been October 16, 2020 DVotW, Examples: Data Visualization, Examples: Text Mining/Analysis 1 Comment
Data Viz of the Week #9: Analyzing the Use of ‘Anti-Lynching’ using HTRC+Bookworm

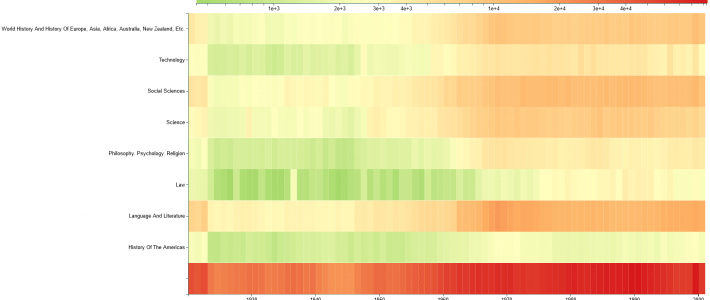
Data Visualization with the HTRC’s Bookworm Tool by Eileen Bentsen, Librarian – English, History, Honors College, & Medical Humanities On October 26, 1921, President Harding gave a speech in Alabama condemning lynching. While the speech, by today’s standards, would be

Read more

Data Viz of the Week #8: Altmetrics for the Creative and Performing Arts

joshua_been October 10, 2020November 1, 2020 DVotW, Examples: Data Visualization No Comments
Data Viz of the Week #8: Altmetrics for the Creative and Performing Arts

DVotW (Data Viz of the Week) #8 Published: Monday, October 12, 2020 Title: Altmetrics for the Creative and Performing Arts Contributors: Christina Chan-Park, Sha Towers, Clayton Crenshaw, Joshua Been Data: Data collected in Spring 2020 by Christina Chan-Park, Clayton Crenshaw,

Read more
  • « Previous
Copyright © 2021 . Powered by WordPress. Theme: Ample by ThemeGrill.
Back To Top