
Problem: When building online, interactive visualizations (i.e., data dashboards), a difficult obstacle to overcome is maintaining the visualization after the initial publishing online . How to easily and quickly add add, remove, or modify records? How can research partners conveniently modify records and see the results online?
Solution: When using major platforms such as Tableau Desktop and Power BI, the best solution for researchers using tables and spreadsheets is to host their tables online via OneDrive and Google Sheets.
- When using Tableau Desktop, connect directly to Google Sheets. Any update made to Google Sheets will be automatically represented in the published visualization within 24 hours.
- When using Power BI, connect directly to a table in OneDrive. Any update made to the table will be automatically represented in the published visualization within 1 hour.
Play with Two Examples:
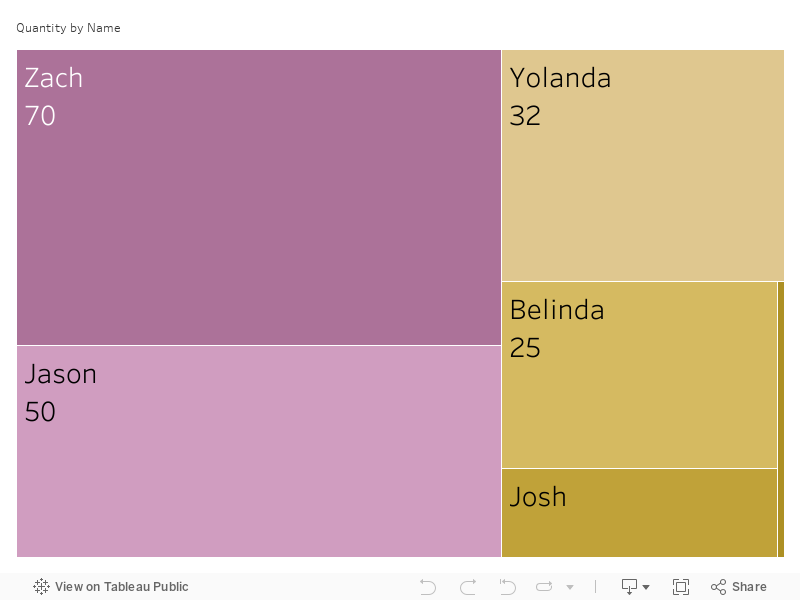
(1) Tableau Visualization Below. Click here to modify the public Google Sheet, and then come back in 24 hours to see the update.
(2)Power BI Visualization Below. Click here to modify the public Excel file hosted on OneDrive, and then come back in 1 hour to see the update.