
 Description:
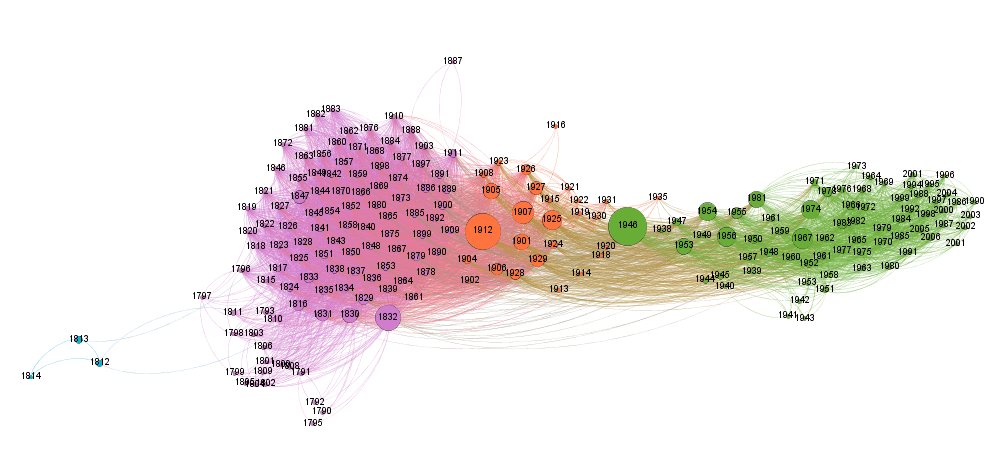
All Presidential State of the Union Addresses from 1790-2006 organized by similarity of terms within the text and colors showing 4 communities, or classes, of Addresses. This is an example of applying social network analysis to text similarity. It is interesting to see the most central and significant Addresses were Truman’s in 1946 and Taft’s in 1912. (You can see this by the size of the node.) Also interesting to see the various years that were clustered into communities of similarity, as visualized by node color. Interested in this type of research? Join us this Friday morning! Register for the Gephi workshop here.
Method:
Step #1: Calculate document similarity
- TF-IDF scores for each term were calculated throughout the corpus.
- Cosine similarity was calculated between each document’s TF-IDF scores
- Try out the Python script here: https://colab.research.google.com/drive/1MuVZg8ALZRKvBhfuVSLbk_Wj_Hn1wx2S. The script relies heavily on the scikit-learn library.
Step #2: Create network visualization (above)
- Gephi software
- Filters: Edge Weight (document similarity): >=.3 (30%), Node Degree: >=2
- Layout: Force Atlas 2, Noverlap
- Node Sizes: Proportional by Betweeness Centrality
- Node Color: 4 Modularity Class Communities
- Labels: Year
Data Source:
- Source Document via Project Gutenberg: State of the Union Addresses (1790-2006) by United States. Presidents
State of the Union Addresses: Networking Similarities