
Google Fusion Tables are a web-based GIS tool that let you easily map a large number of points.
Set up: First you may need to clean your data a little. In this example, I mostly split up columns and standardized the names of publication cities (for example making all entries “St. Louis, MO” instead of a mixture of “St. Louis, MO” “Saint Louis, Mo.” and “St. Louis, Mo.”) I won’t go into specifics here but look for a post dedicated to data cleaning in the future. (In the meantime, if you need help with data cleaning please contact us).
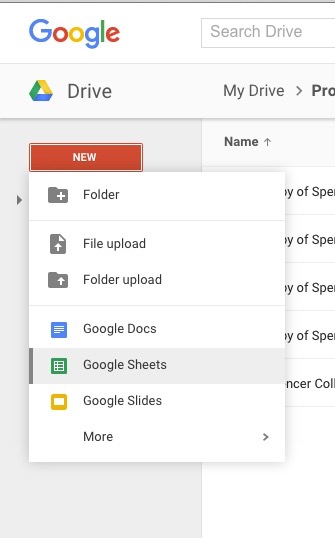
1. Put the data into Google Sheets: To do this go to Google Drive and click the red “new” button on the left side. Select Google Sheets from the drop down menu. Then import or copy and paste your data into the sheet. Name your file something you’ll remember and then exit the sheet.
2. Create a Fusion Table: From your Google Drive click the red “new” button then select more from the drop down menu. From the extended list that appears select Google Fusion Tables. *If Fusion tables are not on option displayed, click “connect more apps” and then search for Fusion Tables, when it comes up, click the blue connect button. When you return to the “more” section Goggle Fusion Tables should now appear.

3. From the Fusion Table import a new table. Select “Google Spreadsheets” and then find the sheet you made in step 1. Click next and then identify which row has the column names in it. Click next again.

4. Name the Table, decide if you want to allow the export of the data, and, if you want, provide a description of the table. Hit finish.

5. It’s possible Google will auto recognize your location data. If this happens, all your place names will be highlighted in yellow. In this case, skip step 6.
6. In your table, click on the top of the column that holds your place names. Click on the triangle that appears and select “Change”. In the “Type” drop down box select “Location”. Click save.

7. Click on the red + button at the top of the table. Select add map.

8. Goggle will begin Geocoding the data. When it’s done, refresh the page.
9. The Feature Map will display automatically.
10. To display the Heatmap, select “Heatmap” from the sidebar on the left. In the Heatmap setting I found it easier to see the green of the heat map if you change the map to a satellite view. Do this by clicking the button marked “Satellite” in the right top corner of the map.
 Sharing:
Heatmaps: Due to limitations Google has imposed, heatmaps can’t be embedded in a page. To share them take a screen shot (as I did in this post) or share a link to the whole fusion table by clicking the “Share” button in the top right corner of the page.
Feature maps: Feature maps can be embedded.
To embed:
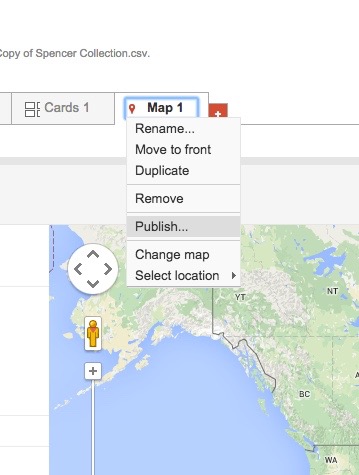
1. Click on the tab labeled “Map 1” at the top of the table and then select “Publish”.
2. Make the table public if prompted by Google that it isn’t public. Then copy the HTML and embed.
Of course, you can also screen shot the map or share it using the link to the Fusion Table, just like the heat map.