
Palladio is a web-based tool designed with Humanists in mind. It allows you to visualize and map data imported via .csv file.
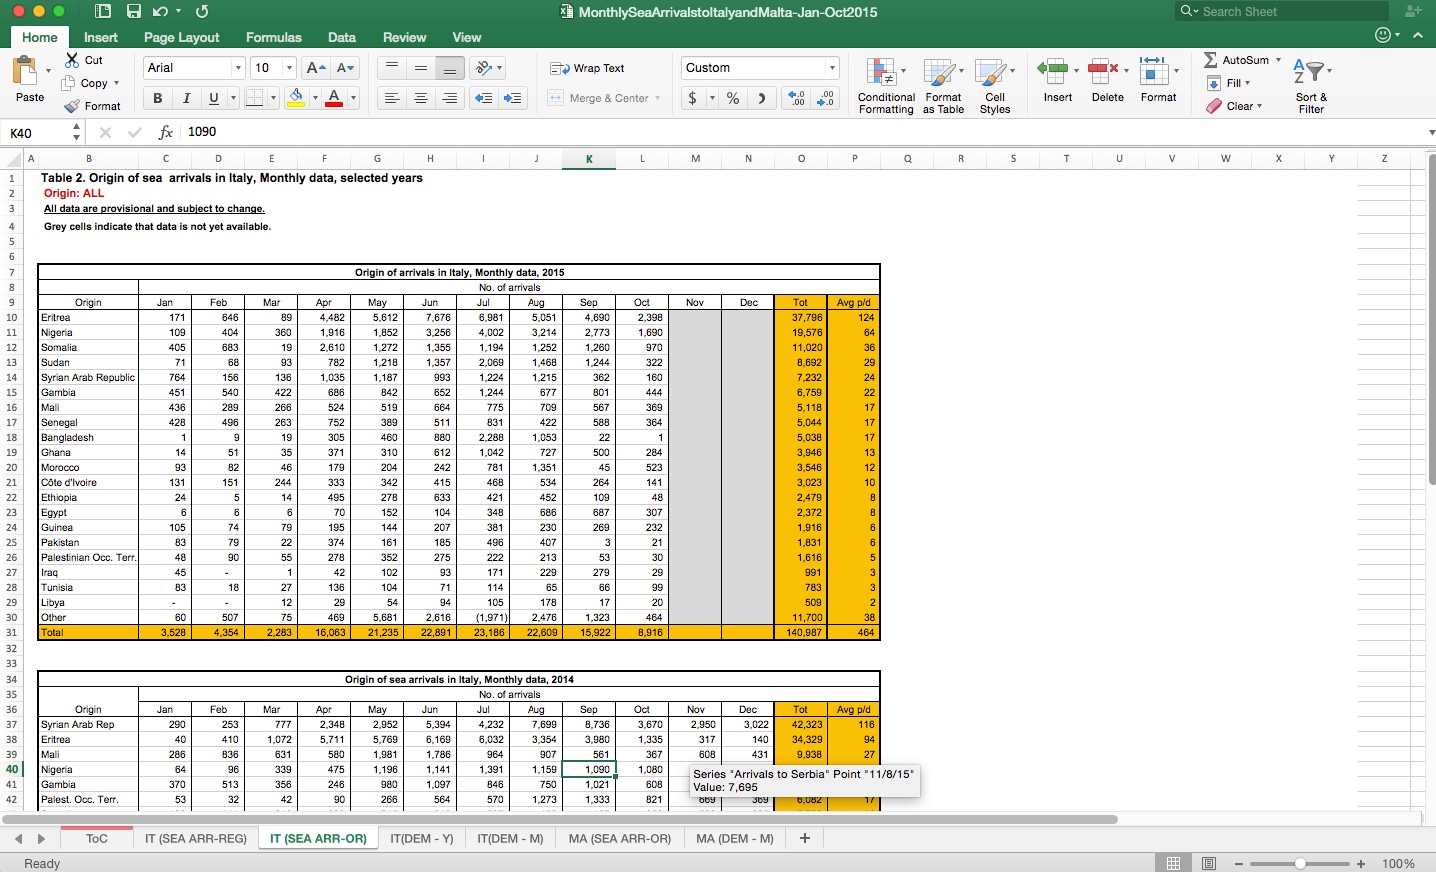
My “pre” step was getting my data. I went to the UNHCR’s Mediterranean Portal to get my data. The spreadsheets looked like this when I first downloaded them:
I merged them together, simplified a few fields and created this spreadsheet:
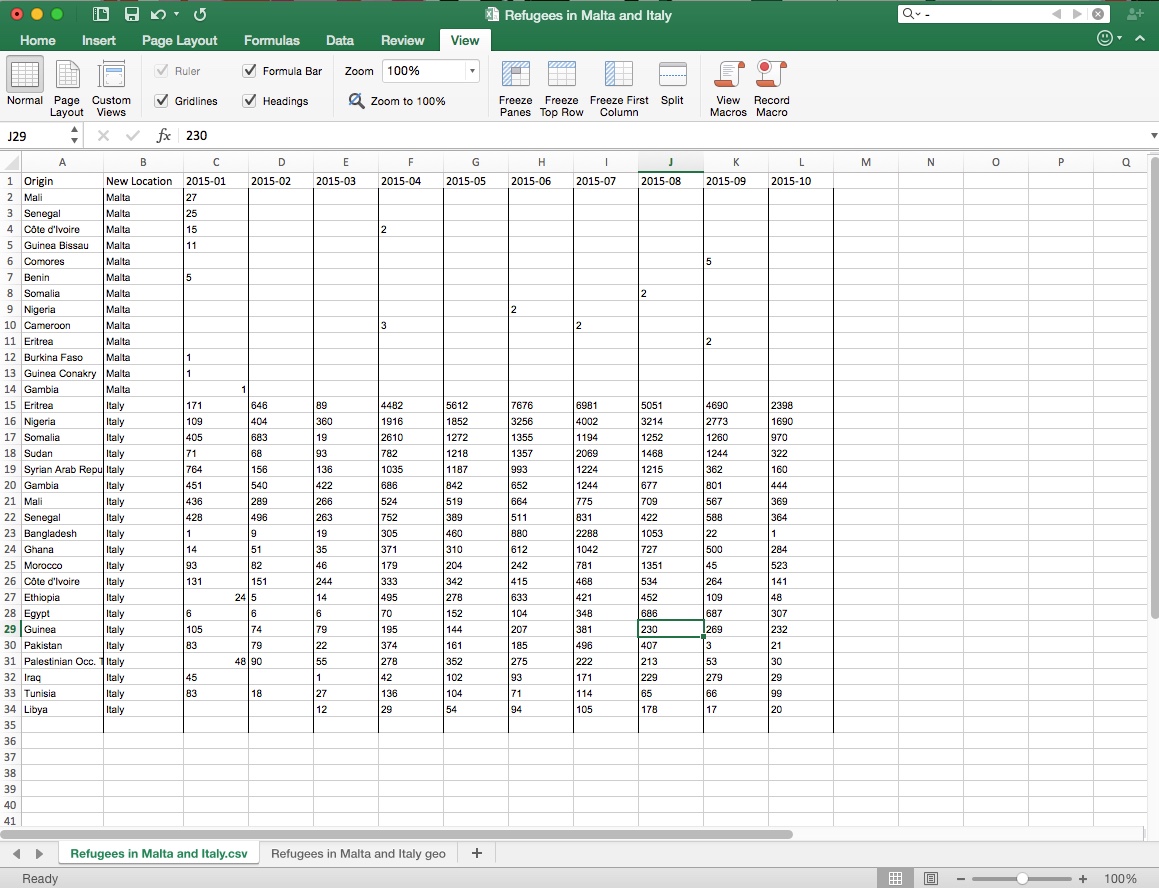
Which I saved as a .csv file.
1. You need to get the geodata (coordinates) for the locations you want to map. You’ll need the coordinates in “Latitude, Longitude” format. There are several ways to do this, but my favorite is to use the ezGeocode add-on for Google sheets. Simply open Google Sheets go to the add-ons tab. Select “Get add-ons…”. Search ezGeocode and add it. When it’s added, open it and click “setup”. ezGeocode will prompt you to put the names of all your places (or exact addresses if you’re using those) into the column marked Address. Then click Geocode. When it’s done geocoding, merge the Latitude and Longitude columns into one column and create a spreadsheet (either in Google Sheets or Excel) that lists only the names of the places in one column and latitude, longitude in another. So it should look like this:

Save it as a .csv file.
2. Go to the Palladio website and click start
3. Upload your primary data sheet (not the one with just coordinates and place names) by dragging the .csv file into the browser window
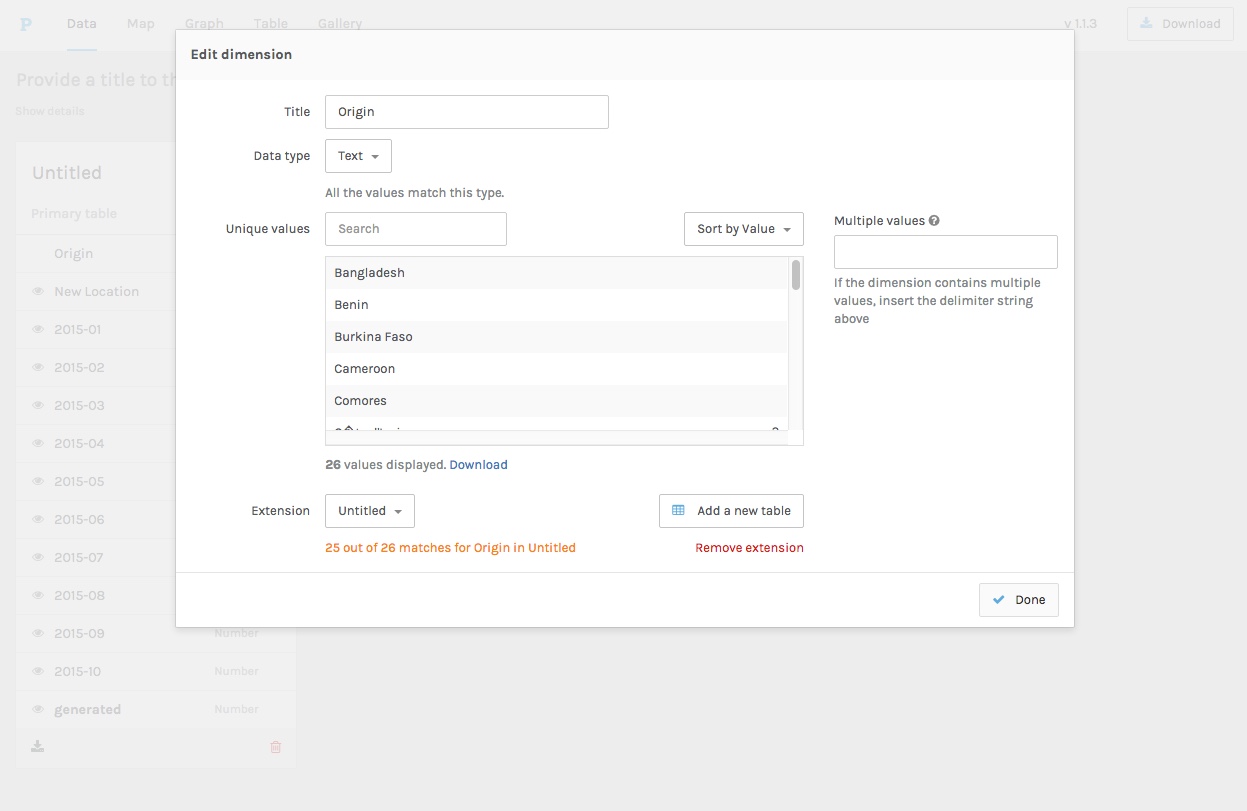
4. Check all the data and edit any data type errors you find (for example, sometimes Palladio doesn’t recognize date fields automatically)
5. Find the first column with locations and click on it to edit. Then associate it with your geodata by clicking “Add a new table” and dragging your .csv file with location names and coordinates into the window. Then click done.
6. If you have more than one column which contains location data, click on the next column the needs geodata association. This time in the edit screen all you have to do is go to the extension drop down menu and select the table (unless you already named the table when you imported it last time, it will show up in the drop down as “Untitled”). Repeat this step with any other columns that need location data.
7. Name your tables. Click on the Download button at the top right corner of the page. This will download your data and the data associations you just made as a file type Palladio can read so the next time you want to work with this data in Palladio you won’t have to upload the tables separately and associate the geodata again.
8. Click on the map tab
9. Select New Layer, select the data tab, and then fill in the information you want in the layer. Repeat this step to create as many layers as you want. For this project I made one for every month of data, but I have also made Palladio maps in the past where I wanted all of my data in one map layer.

10. If you want to change the map in the background. Select new layer again. Then select the titles tab. You can then select any of the pre-loaded map views or select custom tiles and import a map from MapBox. A list of those Mapbox IDs is available here. Just put the ID for the map you want to use into the box labeled Mapbox ID and click add layer.

11. Now you should be all set to explore your map. If your data has multiple facets you can use the Facet, Timeline, and Timespan buttons in the lower left corner to further drill down your data.
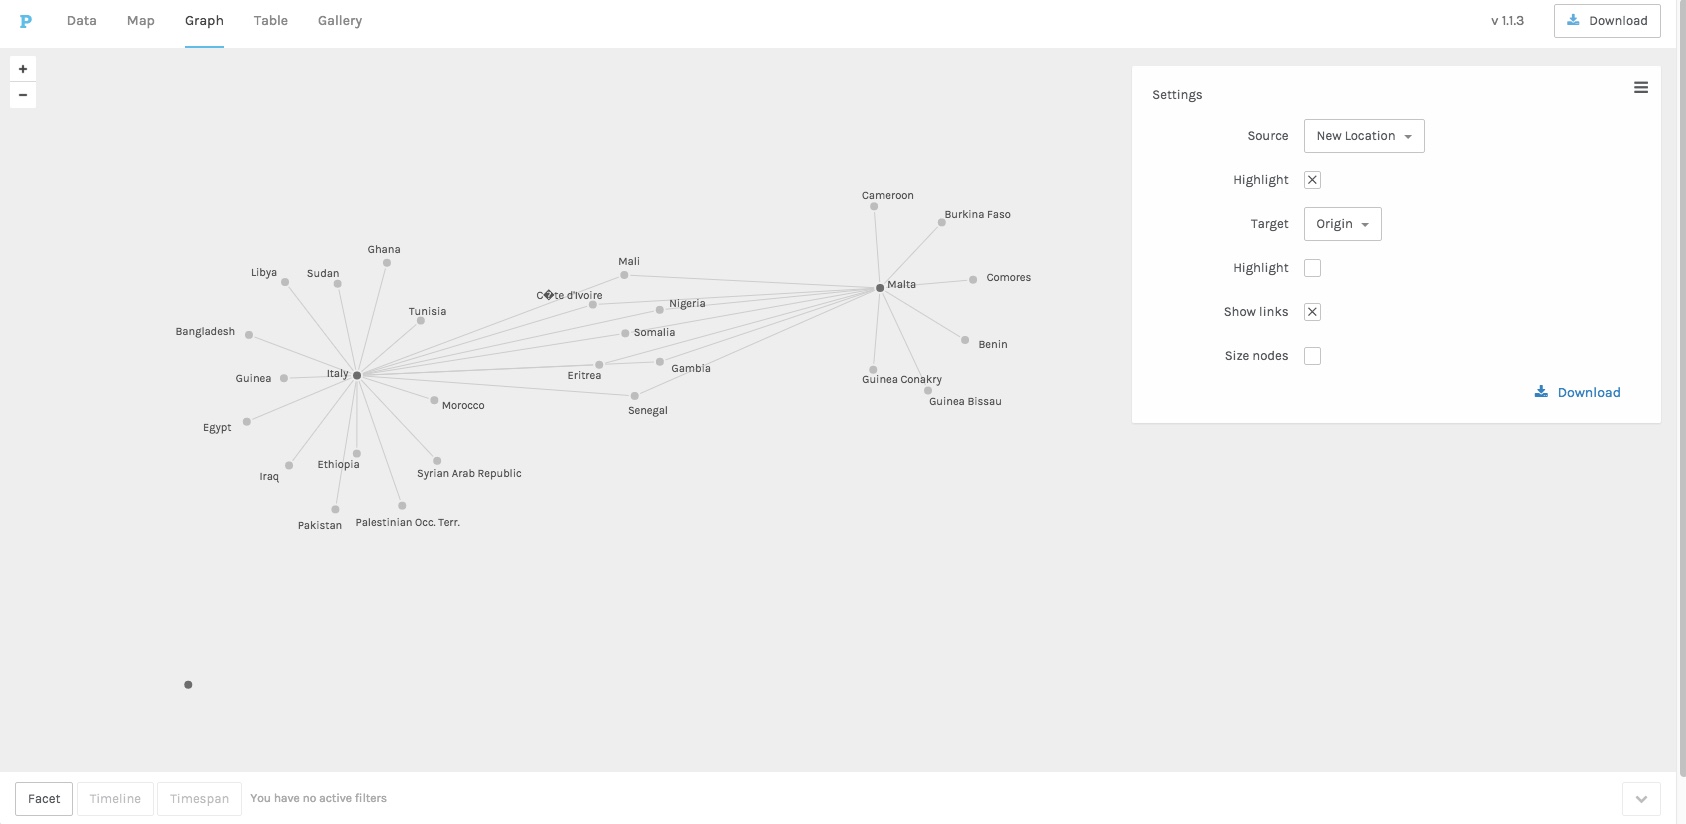
12. To use the graph feature. Select the Graph tab at the top of the page. Chose any 2 features of your data from the Source and Target drop down menus and you’re ready to start looking at the relationship between the 2 features. This graph can be downloaded by clicking the download button in the lower right corner of the settings box.
13. To use the table feature select the Table tab from the top of the page. You can then explore your data in table form.
14. To use the gallery feature you’ll need to include URLs for images in your dataset. If you have those, then the images you associated with each line of data will appear here.
Palladio